 Passport


How And Where Trump Won Wisconsin in 2016
Donald Trump's presidential victory in Wisconsin, the first time a Republican candidate has won the state's electoral votes since 1984, was the result of a complex shift in voting patterns in counties both large and small.
November 18, 2016

APL Election 2016 chart: Rural urban map crop
![]()
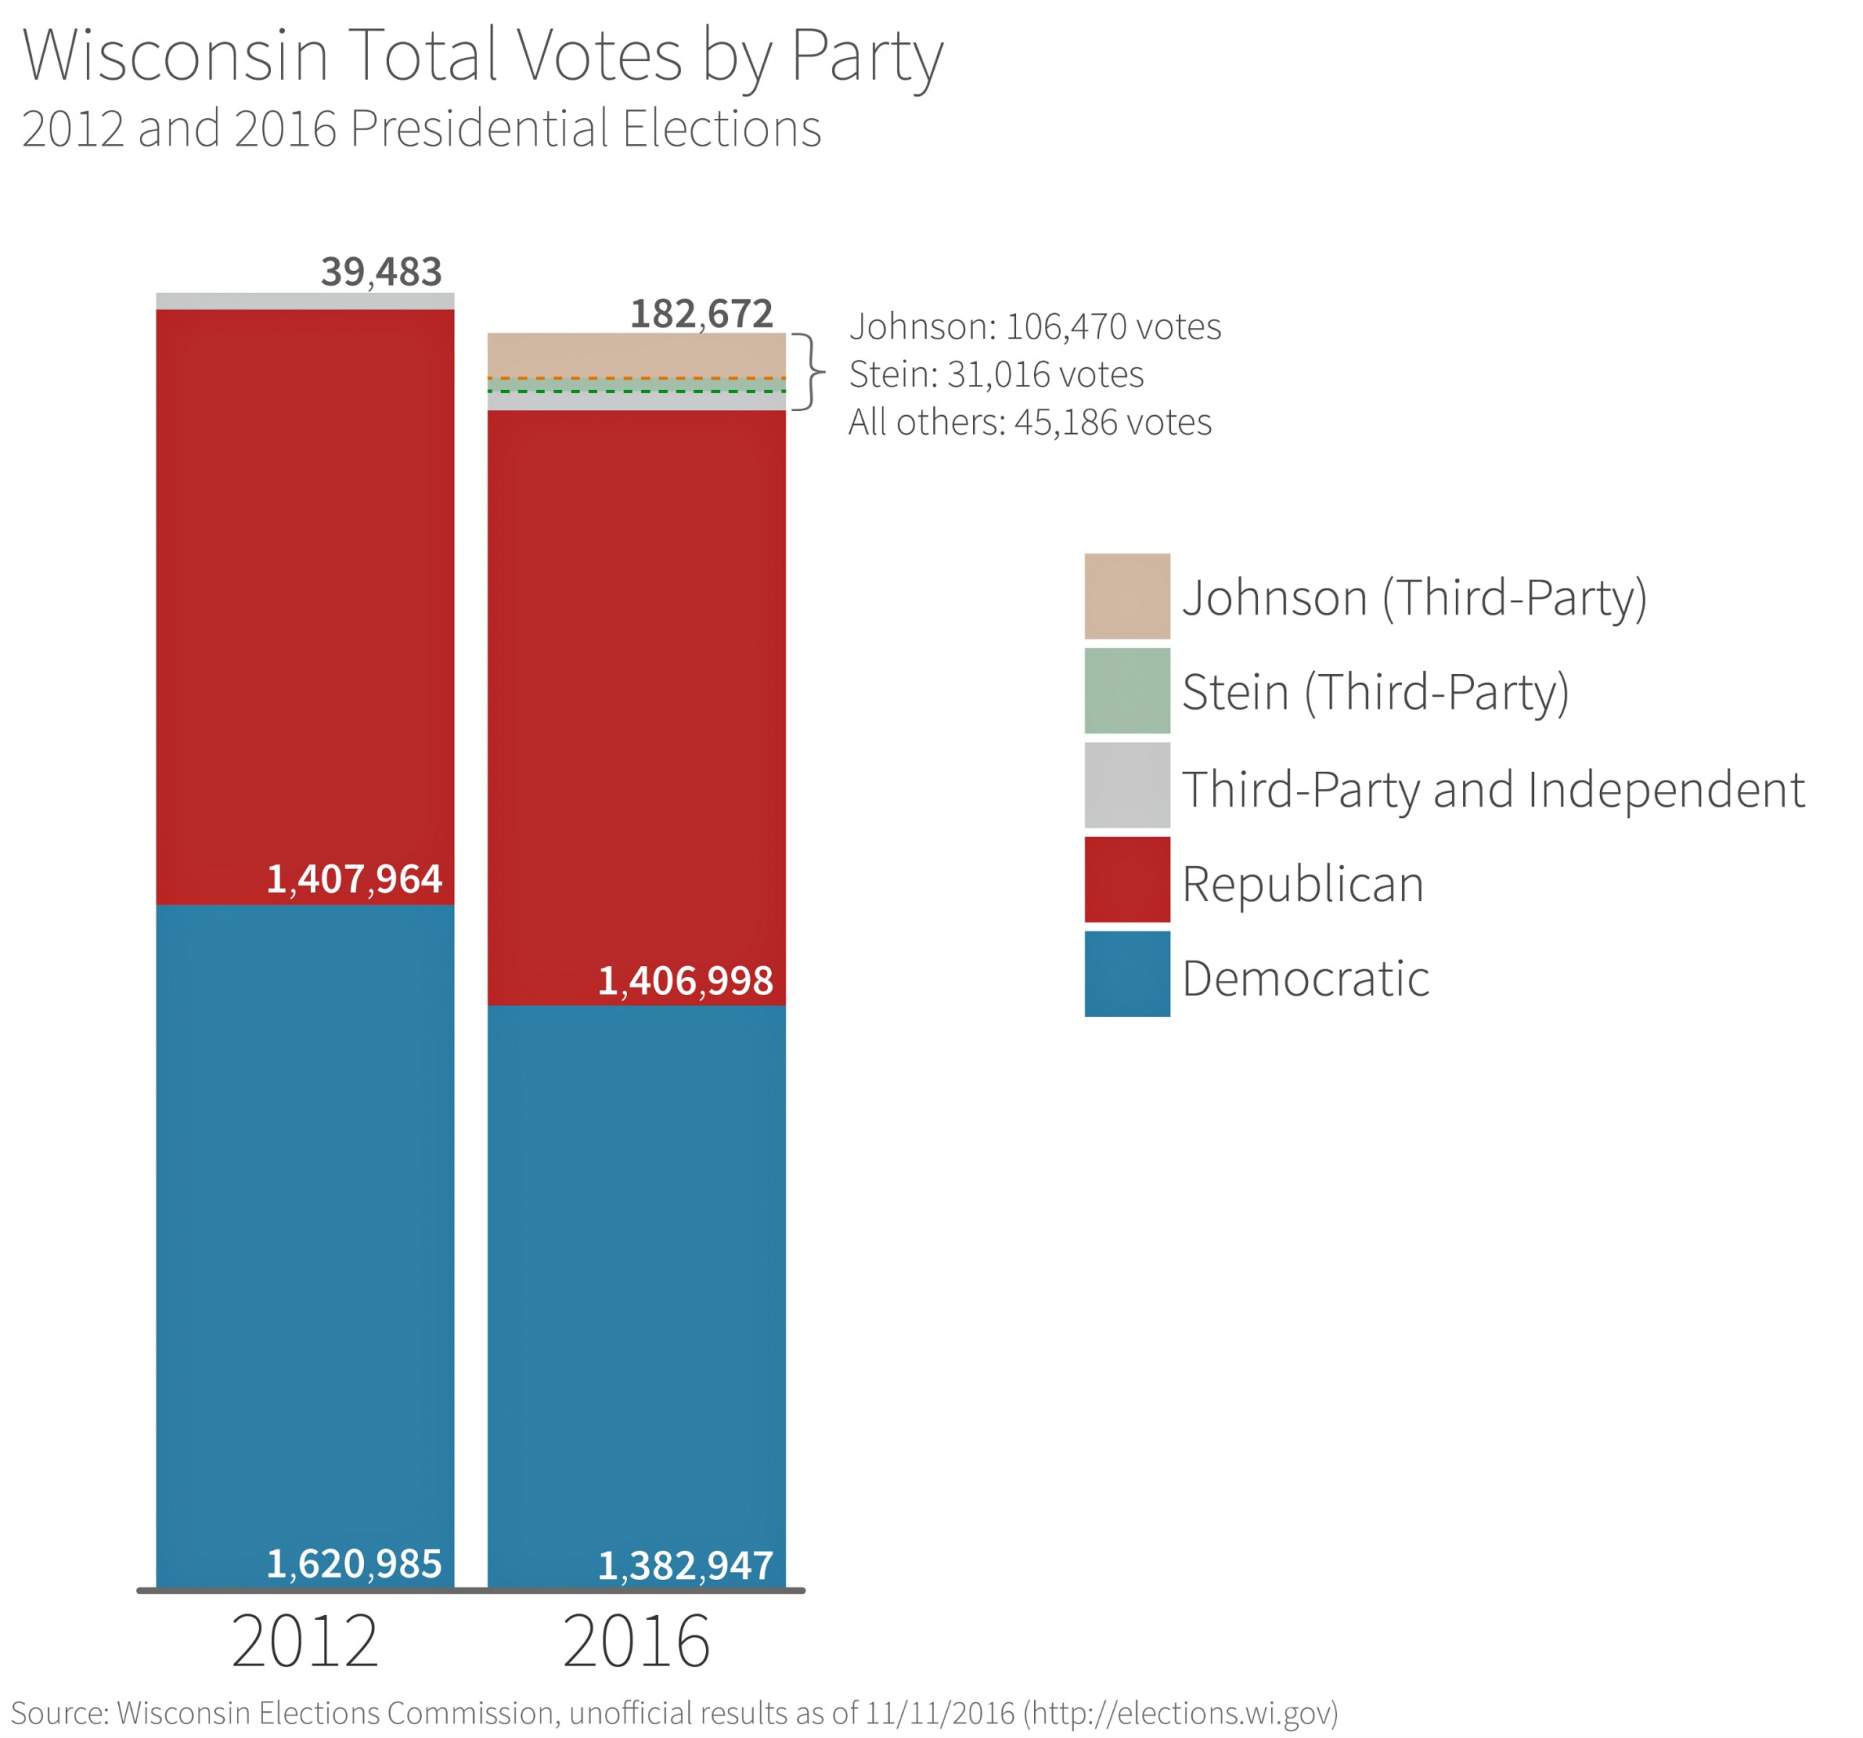
Donald Trump’s 2016 presidential victory in Wisconsin, the first time a Republican candidate has won the state’s electoral votes since 1984, was the result of a complex shift in voting patterns in counties both large and small. Based on unofficial vote totals compiled by the Wisconsin Elections Commission as of Nov. 11, Trump received just over 24,000 more votes than Clinton, out of more than 2.94 million cast overall. Wisconsin’s turnout was about 66 percent of all eligible voters, reported the Wisconsin Elections Commission, the state’s lowest since 1996.
The county-by-county voting results for Wisconsin in the 2016 election offer insight into Trump’s victory in the state. So, too, does a look at the vote numbers in the victory by President Barack Obama over Mitt Romney in 2012. Overall, Trump received just about the same number of votes as Romney, but Clinton received nearly 240,000 fewer votes than Obama.
The difference between the 2012 and 2016 elections was uneven across the state, though. Looking just at the total percentage of voters that supported each candidate conflates two forces: overall voter turnout and how people actually voted. The first issue encompasses how many people went to the polls versus how many were eligible — and the fact that the eligible voting population in each county changes over time due to demographic forces such as migration and aging. The second issue addresses how the ballots were cast by those voters (with their photo ID) who showed up on Election Day or voted early.
Donald Trump’s campaign won in terms of both voter turnout and votes cast in Wisconsin, though he didn’t perform as well as past Republican candidates in some parts of the state, including the major metropolitan areas and at least one conservative stronghold — the Milwaukee suburbs.
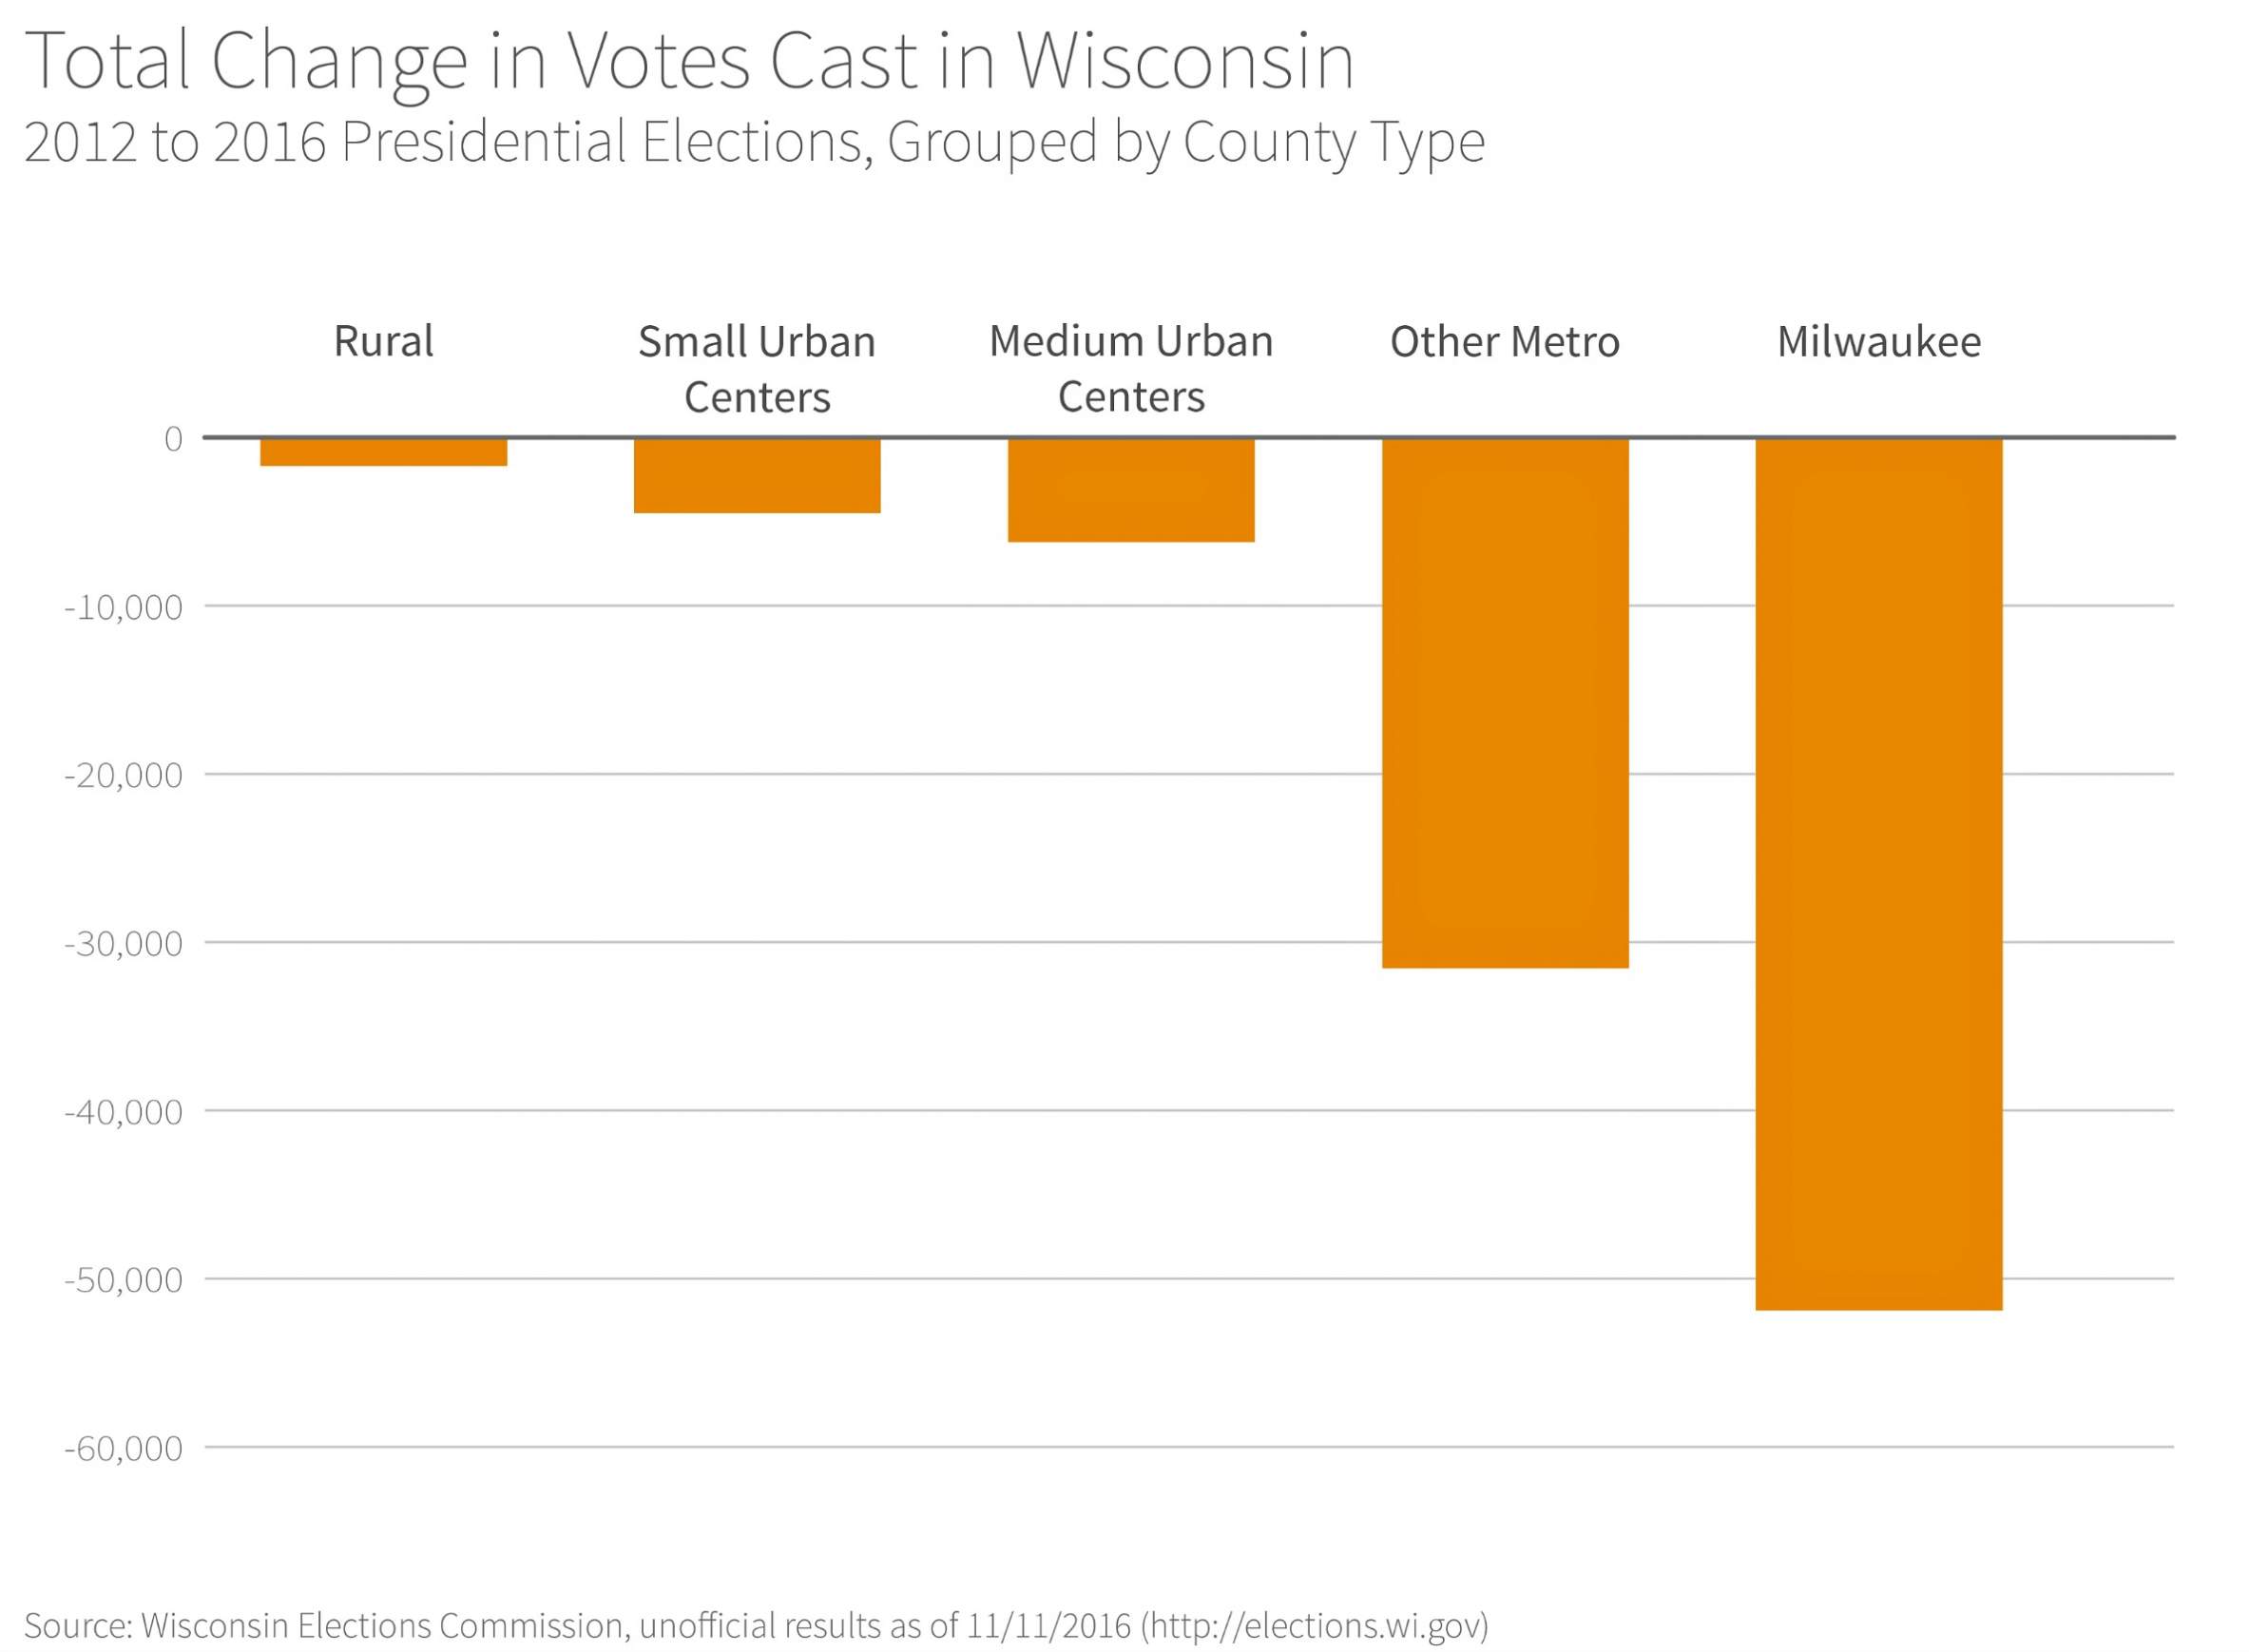
Voter turnout was down overall in 2016 compared to previous elections, but not evenly across the state. Turnout was up or even compared to the 2012 election in several counties. However, turnout was down quite a bit in Wisconsin’s only major city and much of its suburbs, which house a large portion of the electorate.

In Milwaukee County, turnout was down from 68 percent of the adult population to just 61 percent. That represents about 52,000 voters, about two-thirds of whom would likely have voted for the Democratic candidate (based on the outcomes from recent elections). Because Milwaukee County is home to 16 percent of the state’s voting-aged population, low turnout there was critical. In the counties housing medium-sized urban centers and major metropolitan areas aside from Milwaukee, voter turnout was also lower than in 2012 (and lower than in recent history). The major metropolitan counties alone (including Milwaukee County) represent nearly three-quarters of Wisconsin’s voting-age population.
Whatever the reason for this decline in turnout — be it failure of Clinton and the Democratic Party to engage their political base or challenges faced by voters due to new photo identification laws — low voter turnout favored Republican candidates, and the drop could have been the difference between Obama’s win in 2012 and Clinton’s loss in 2016.
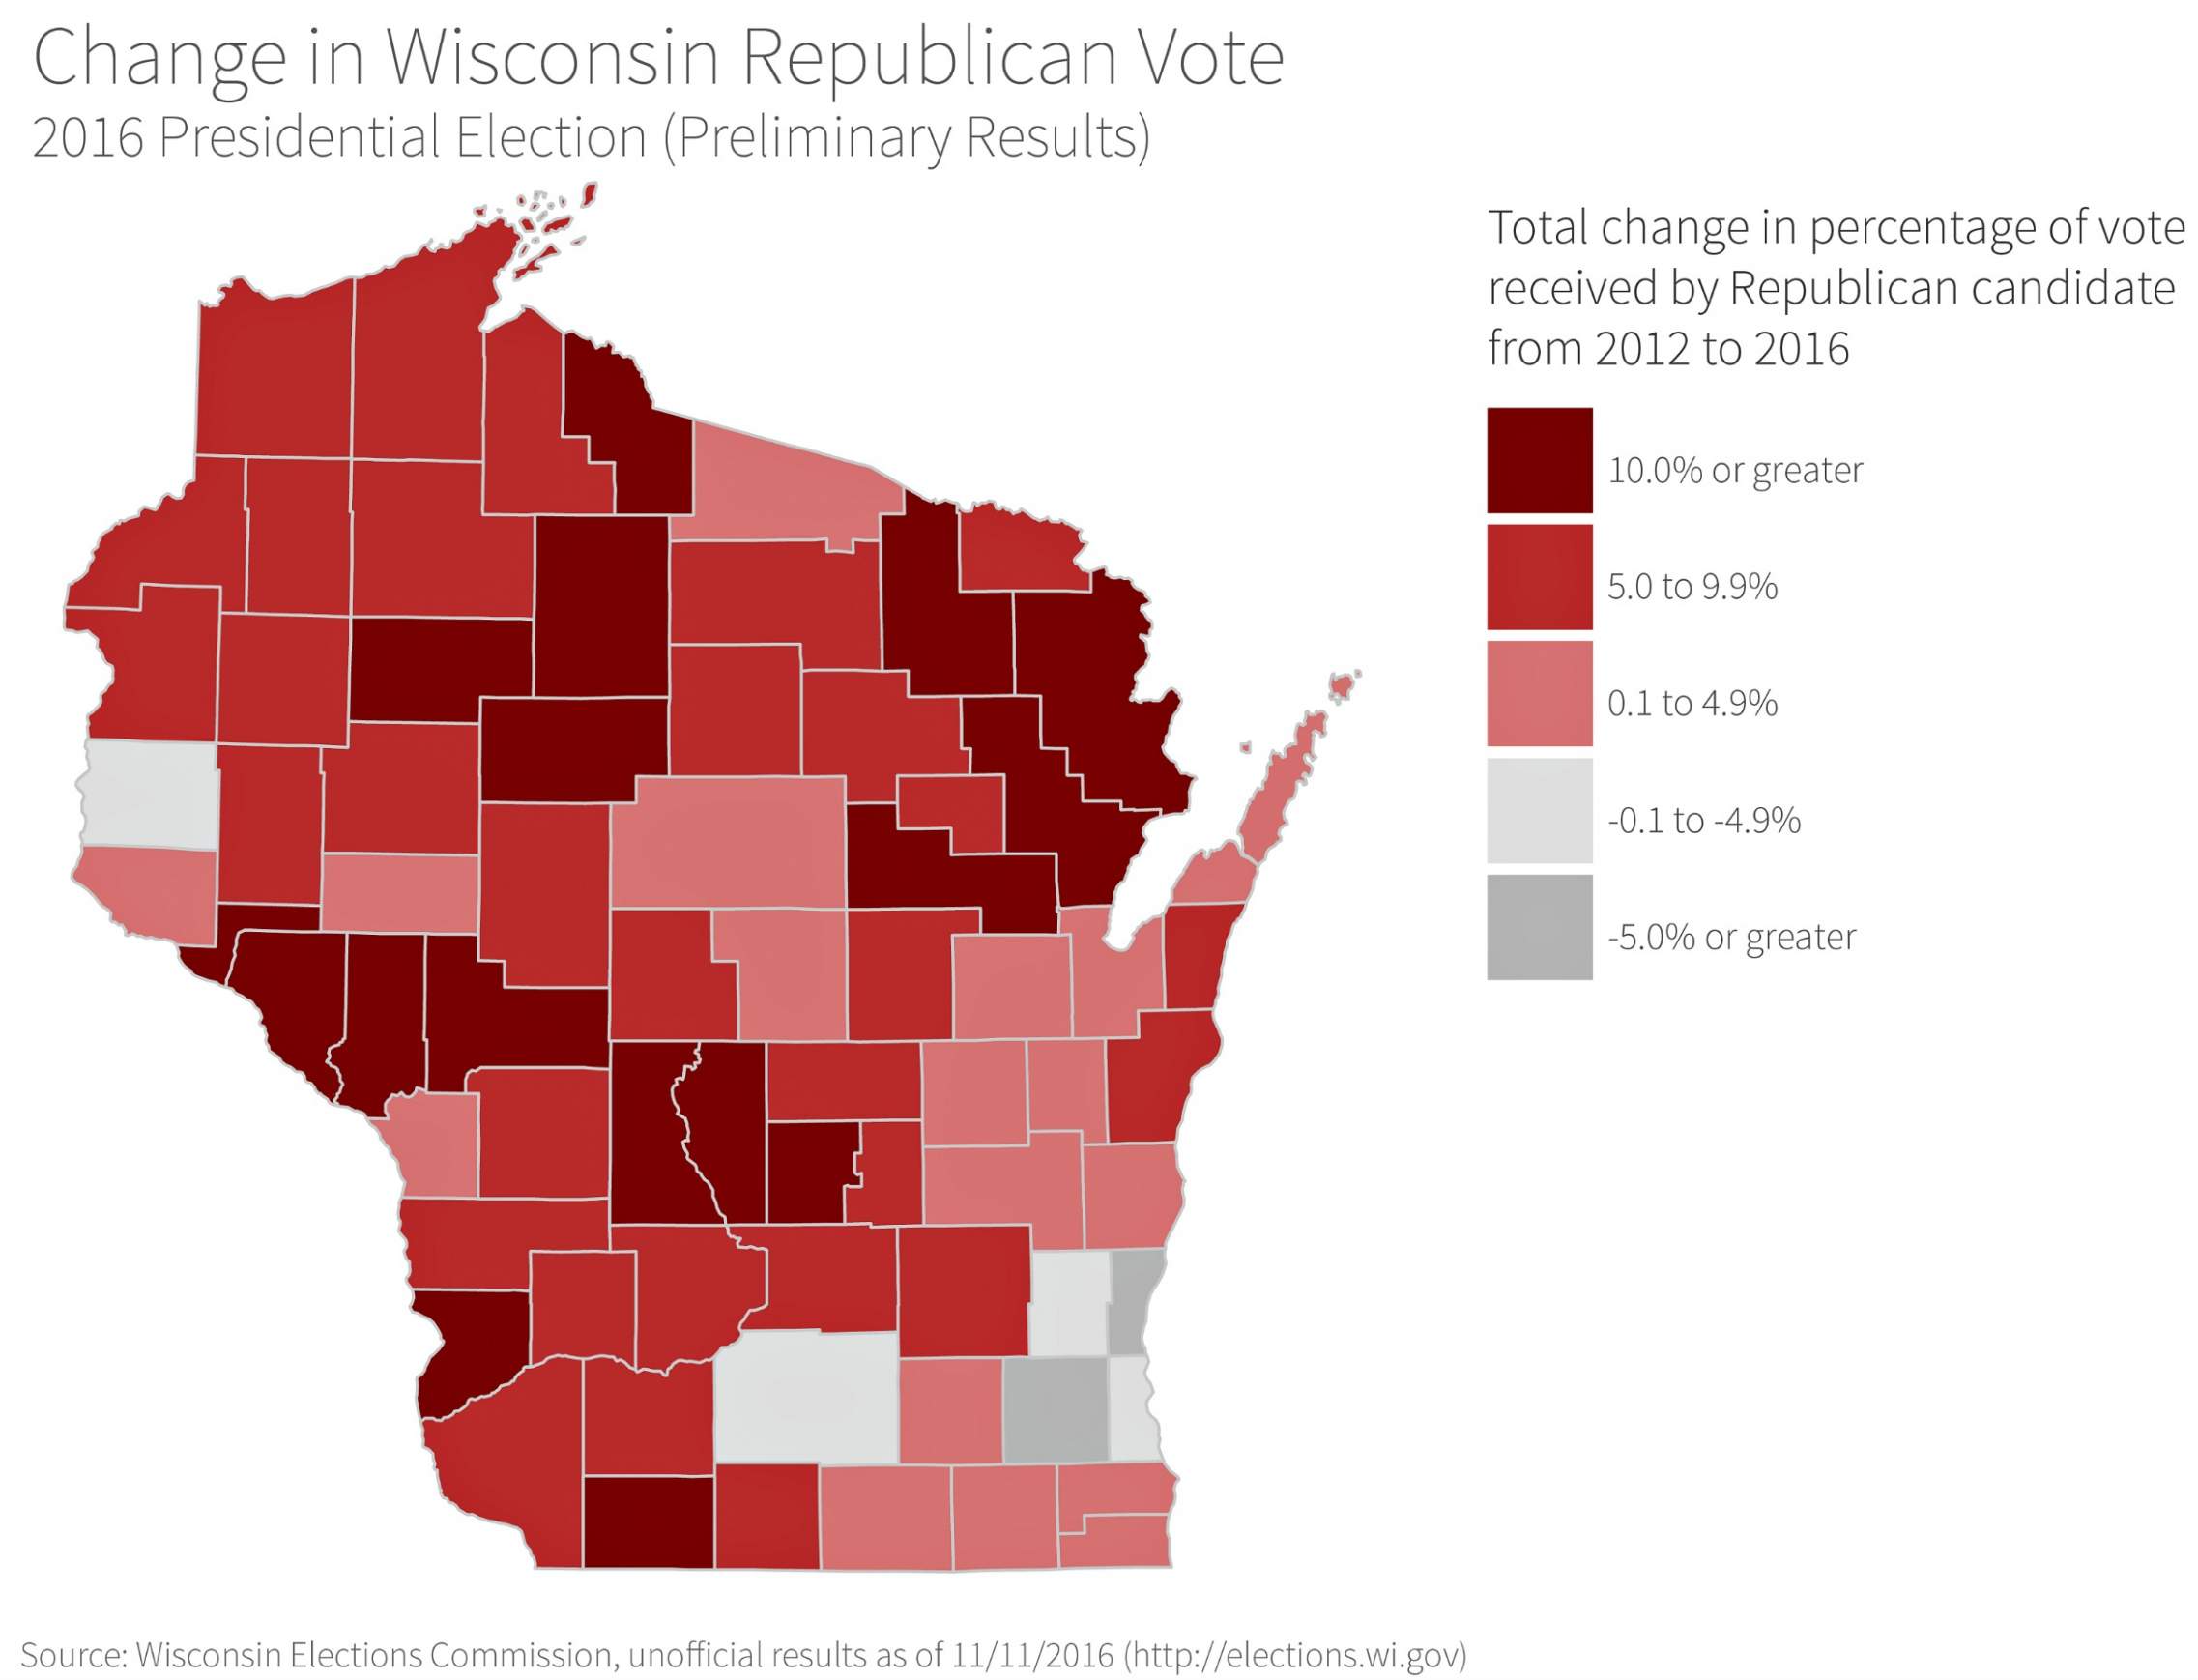
Looking at the vote counts directly, Trump came out ahead of Clinton by about 1 percent statewide. Compared to the percentage of voters for Romney in 2012, Trump gained an average of 6 percent of the vote across all counties.
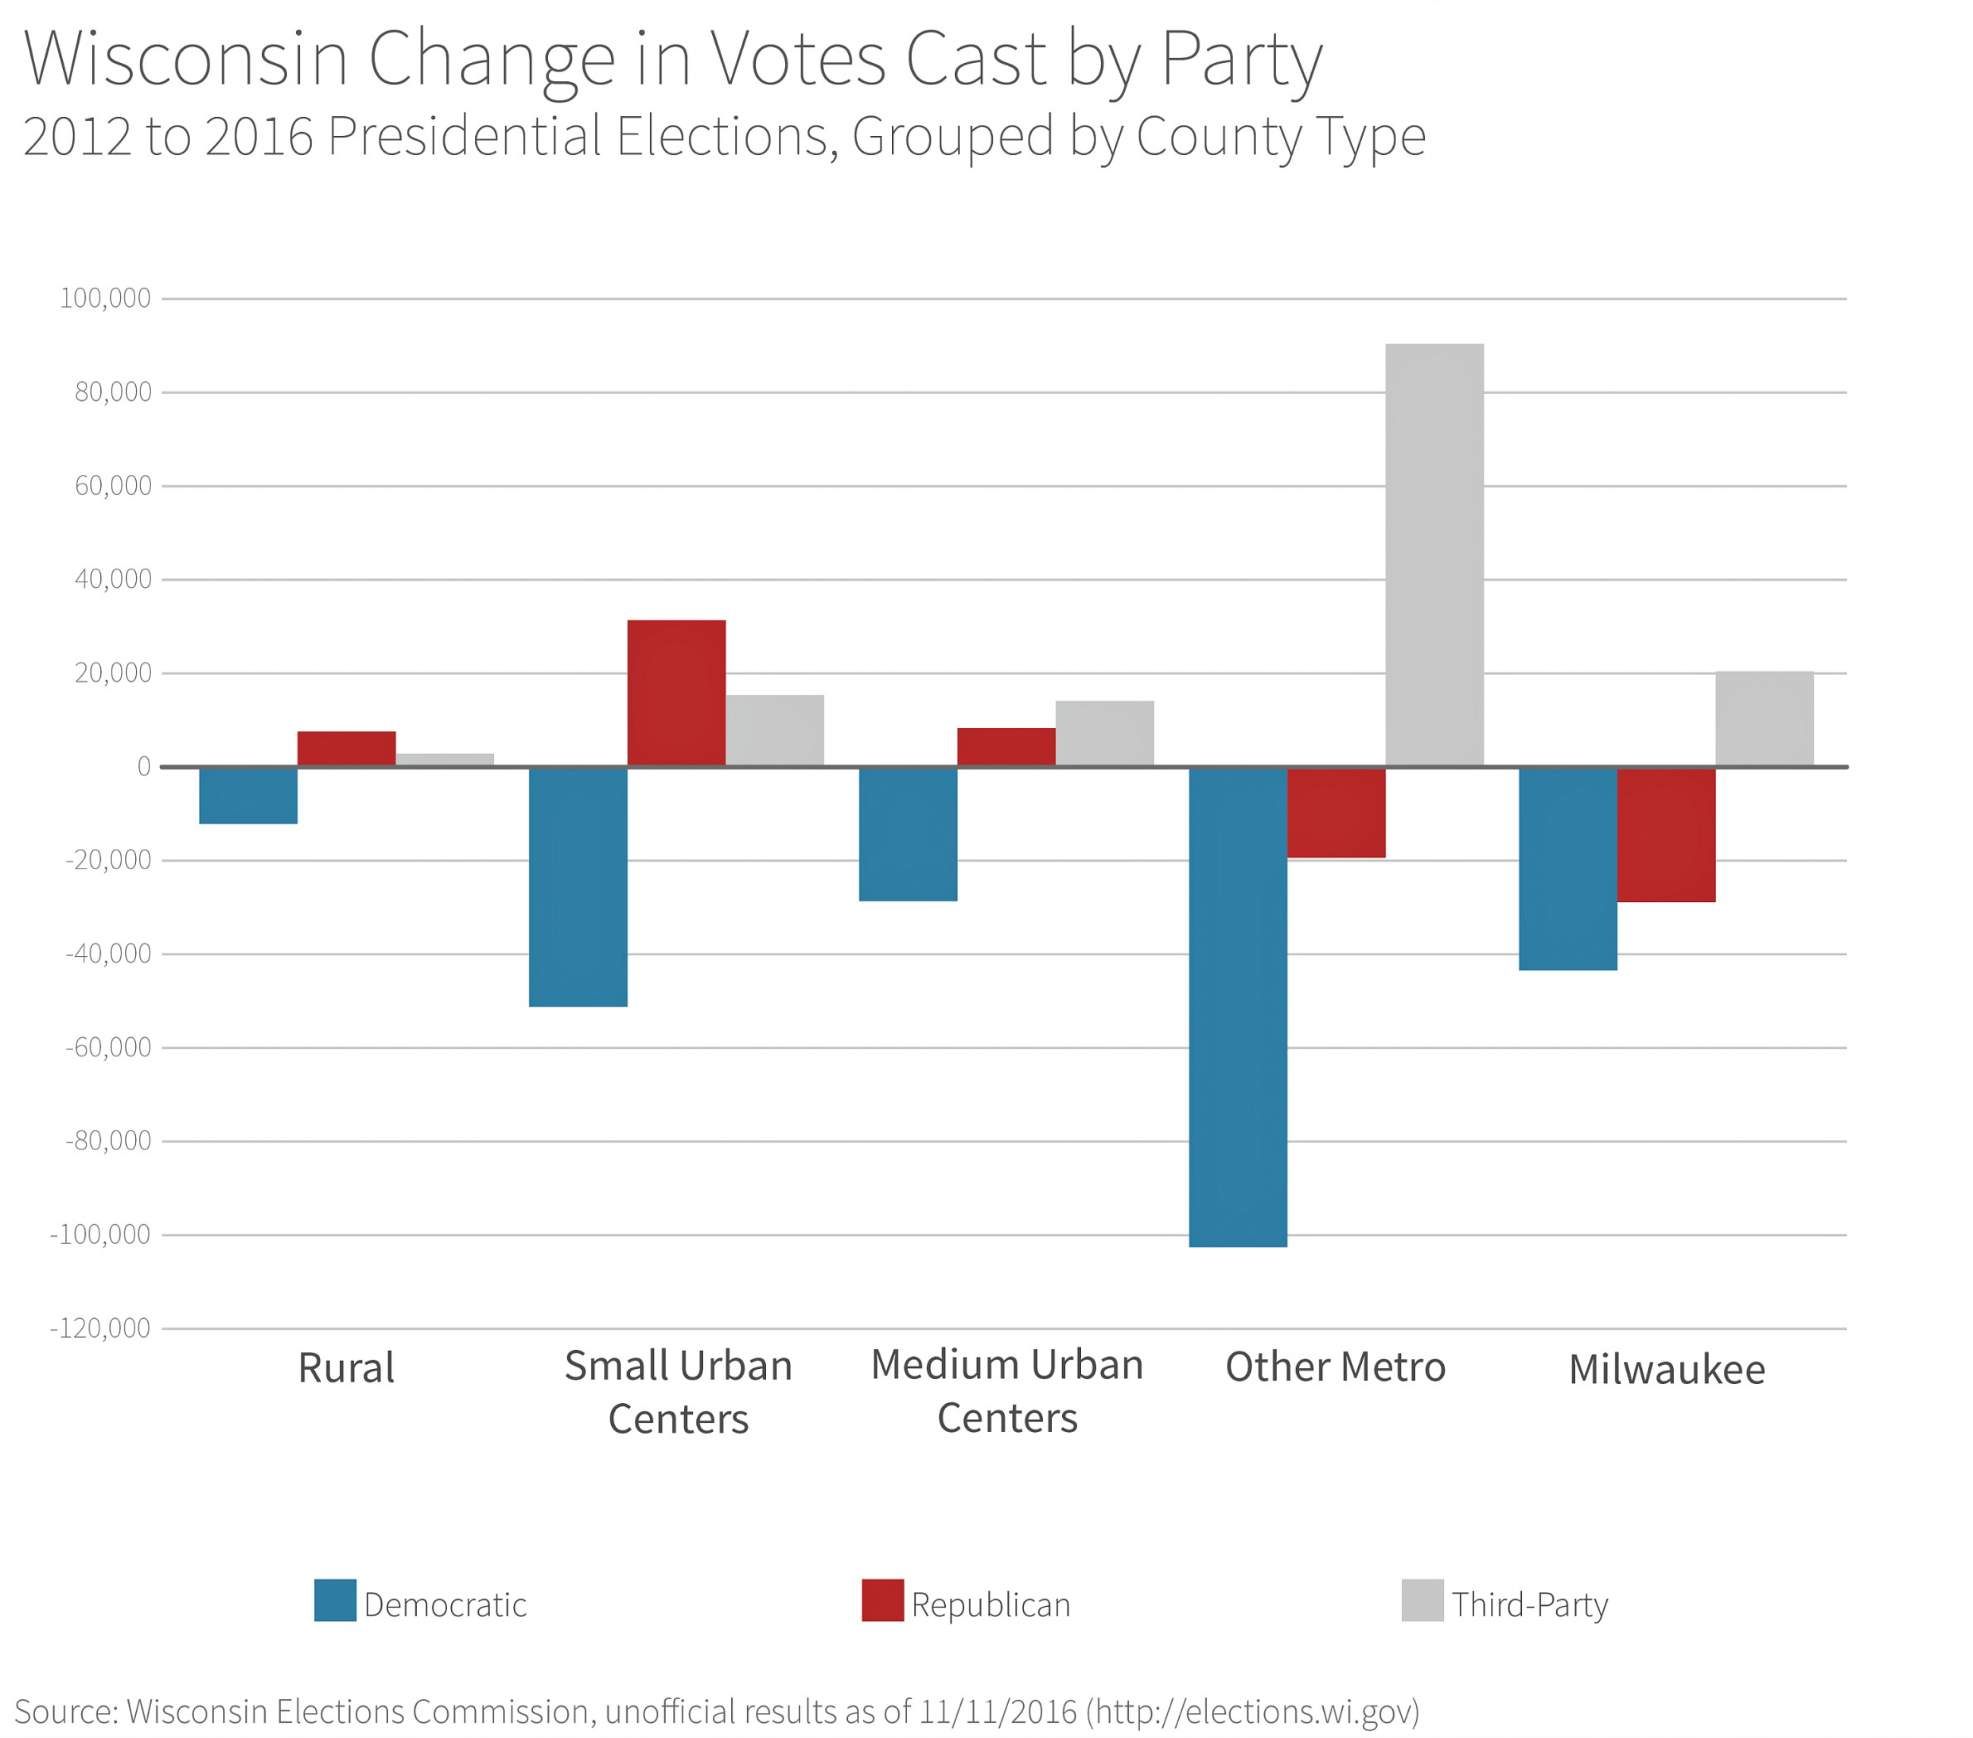
In the state’s most rural areas — counties with no urban center — Trump modestly outperformed Romney on average. With less than 3 percent of Wisconsin’s voting-aged population, though, the total number of votes cast for Trump in these counties was not enough to tip the state over to a Republican win by themselves.
In counties housing small urban centers, Trump’s performance was considerably stronger compared to Romney’s. In counties housing and medium-sized urban centers and their suburbs, Trump also performed modestly better than Romney. Since these counties in aggregate are home to one quarter of the Wisconsin electorate, they were critical to Trump’s victory. Meanwhile, Trump actually picked up fewer votes than Romney on average in the state’s metro-area counties. However, since Democratic votes were overall down compared to 2012, the strength of Trump’s performance in the small and medium sized urbanized areas was enough to give him the win.
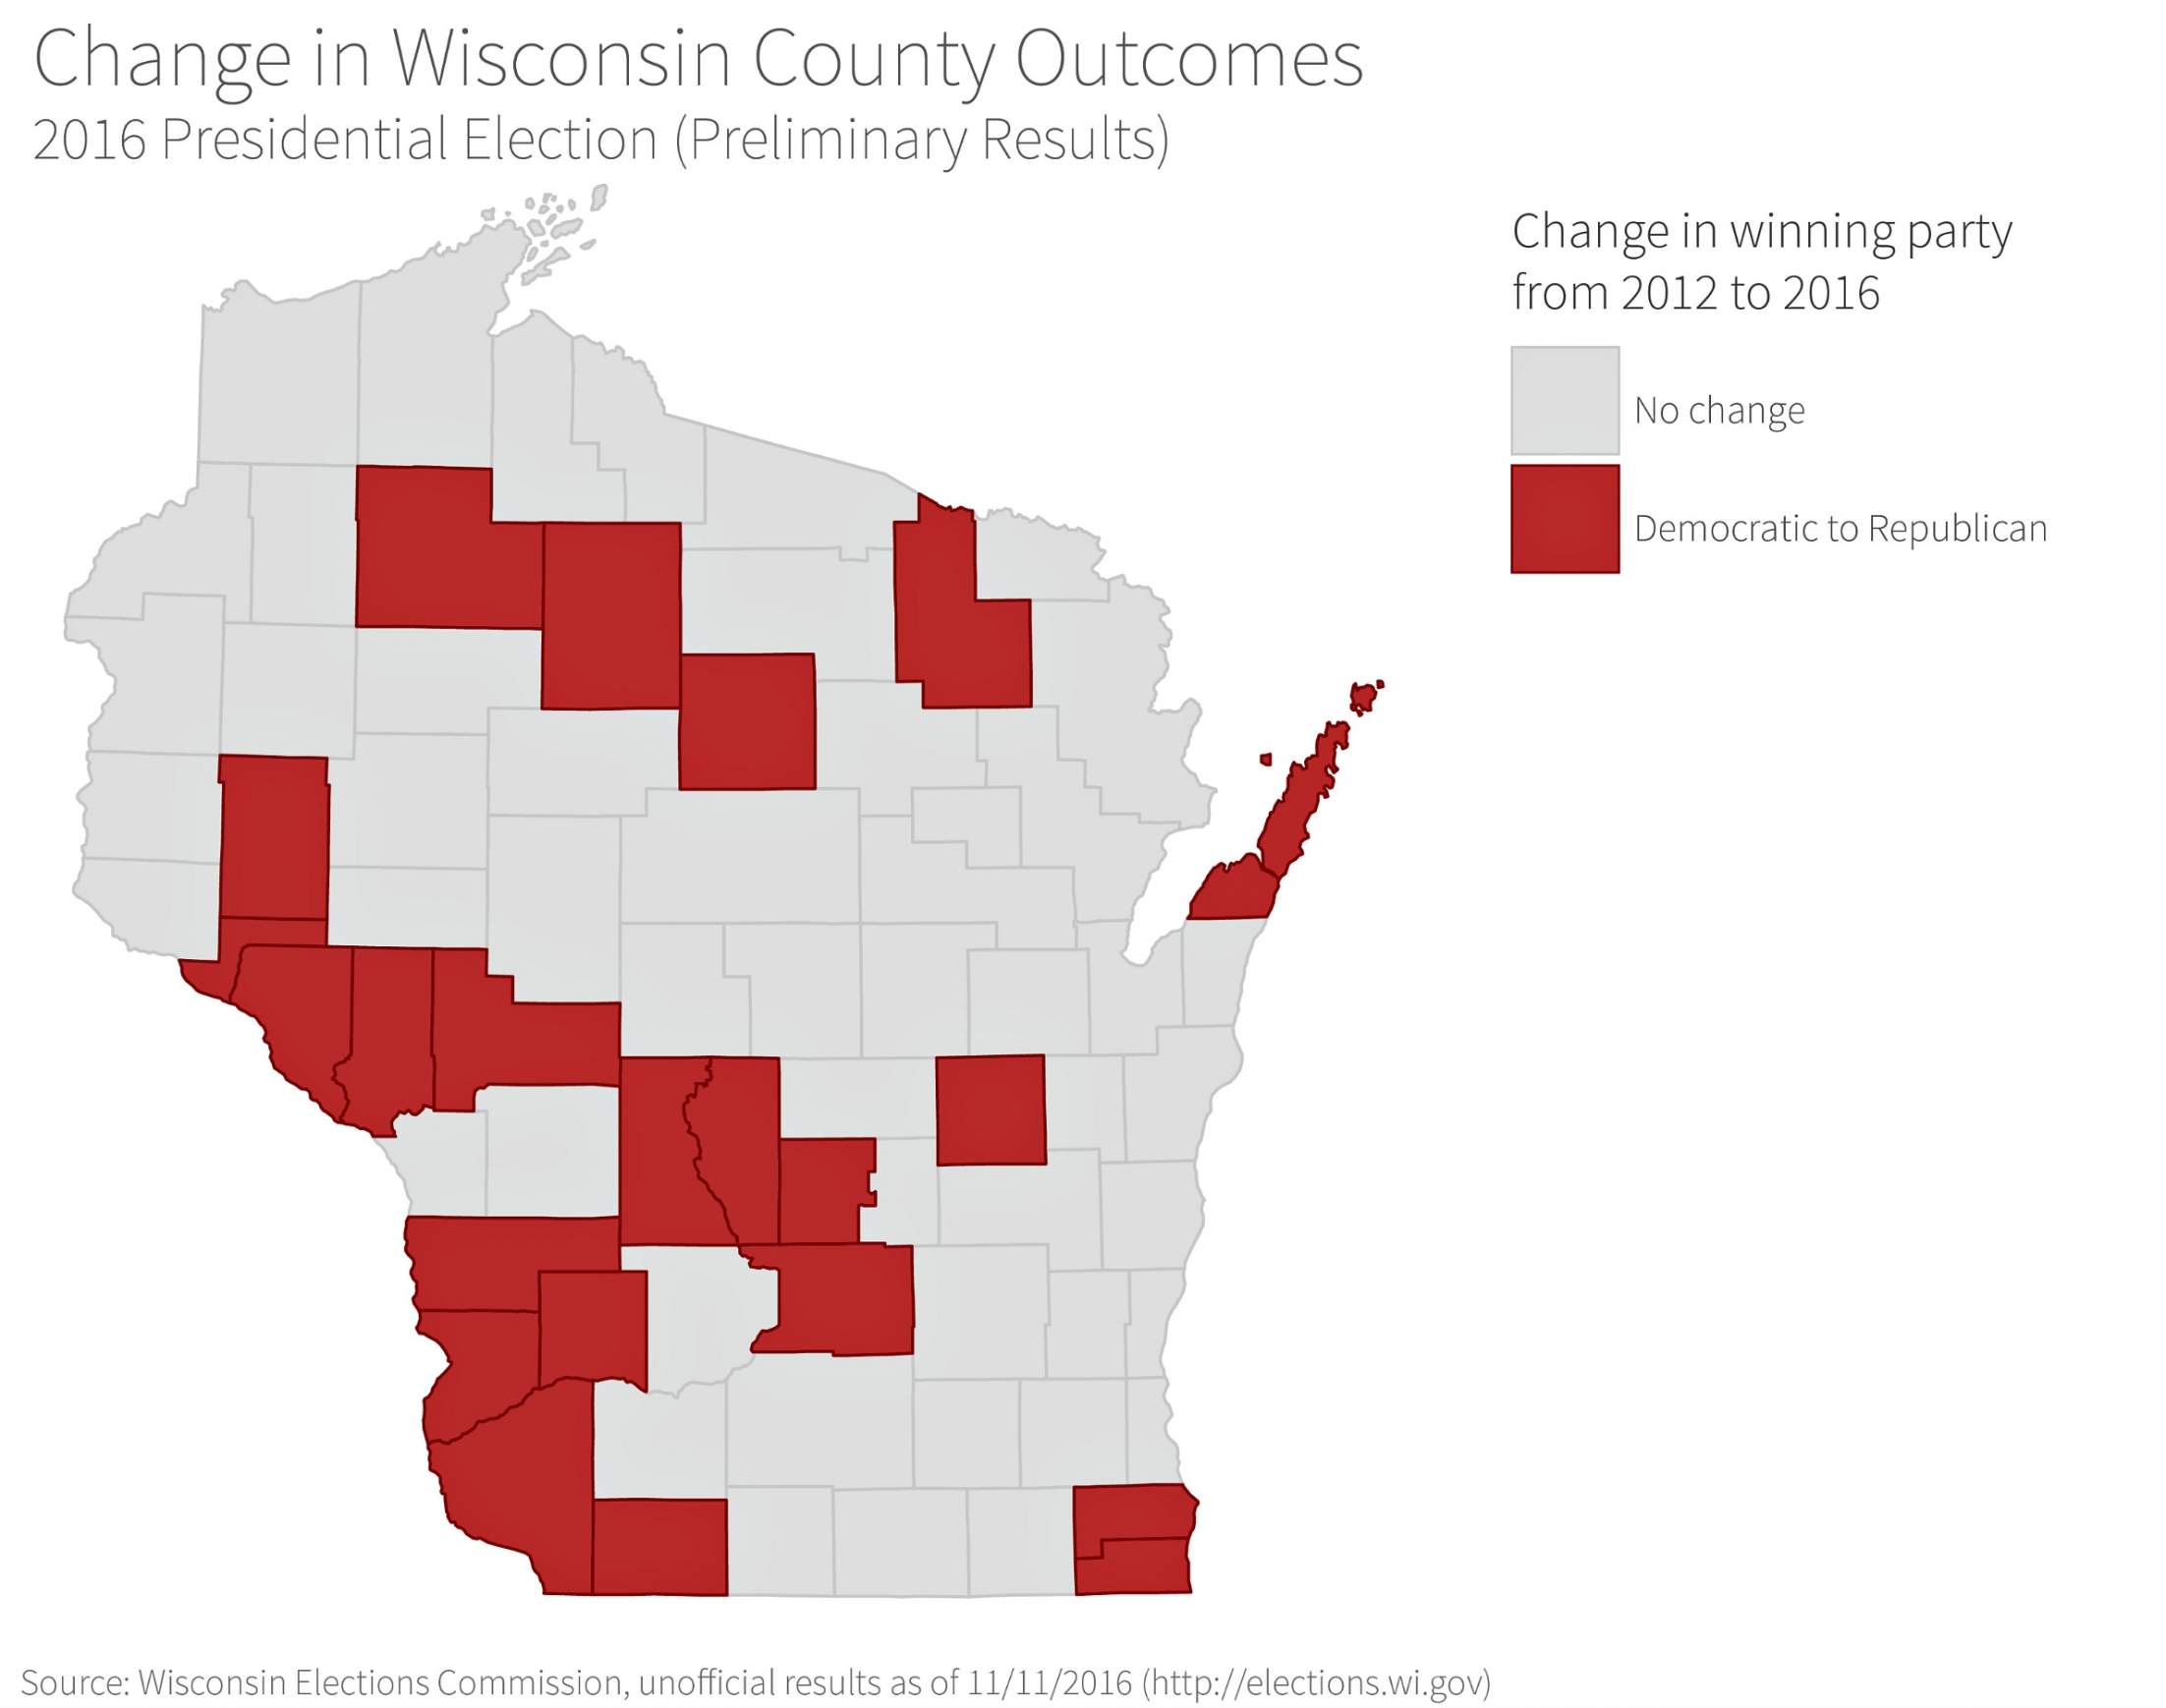
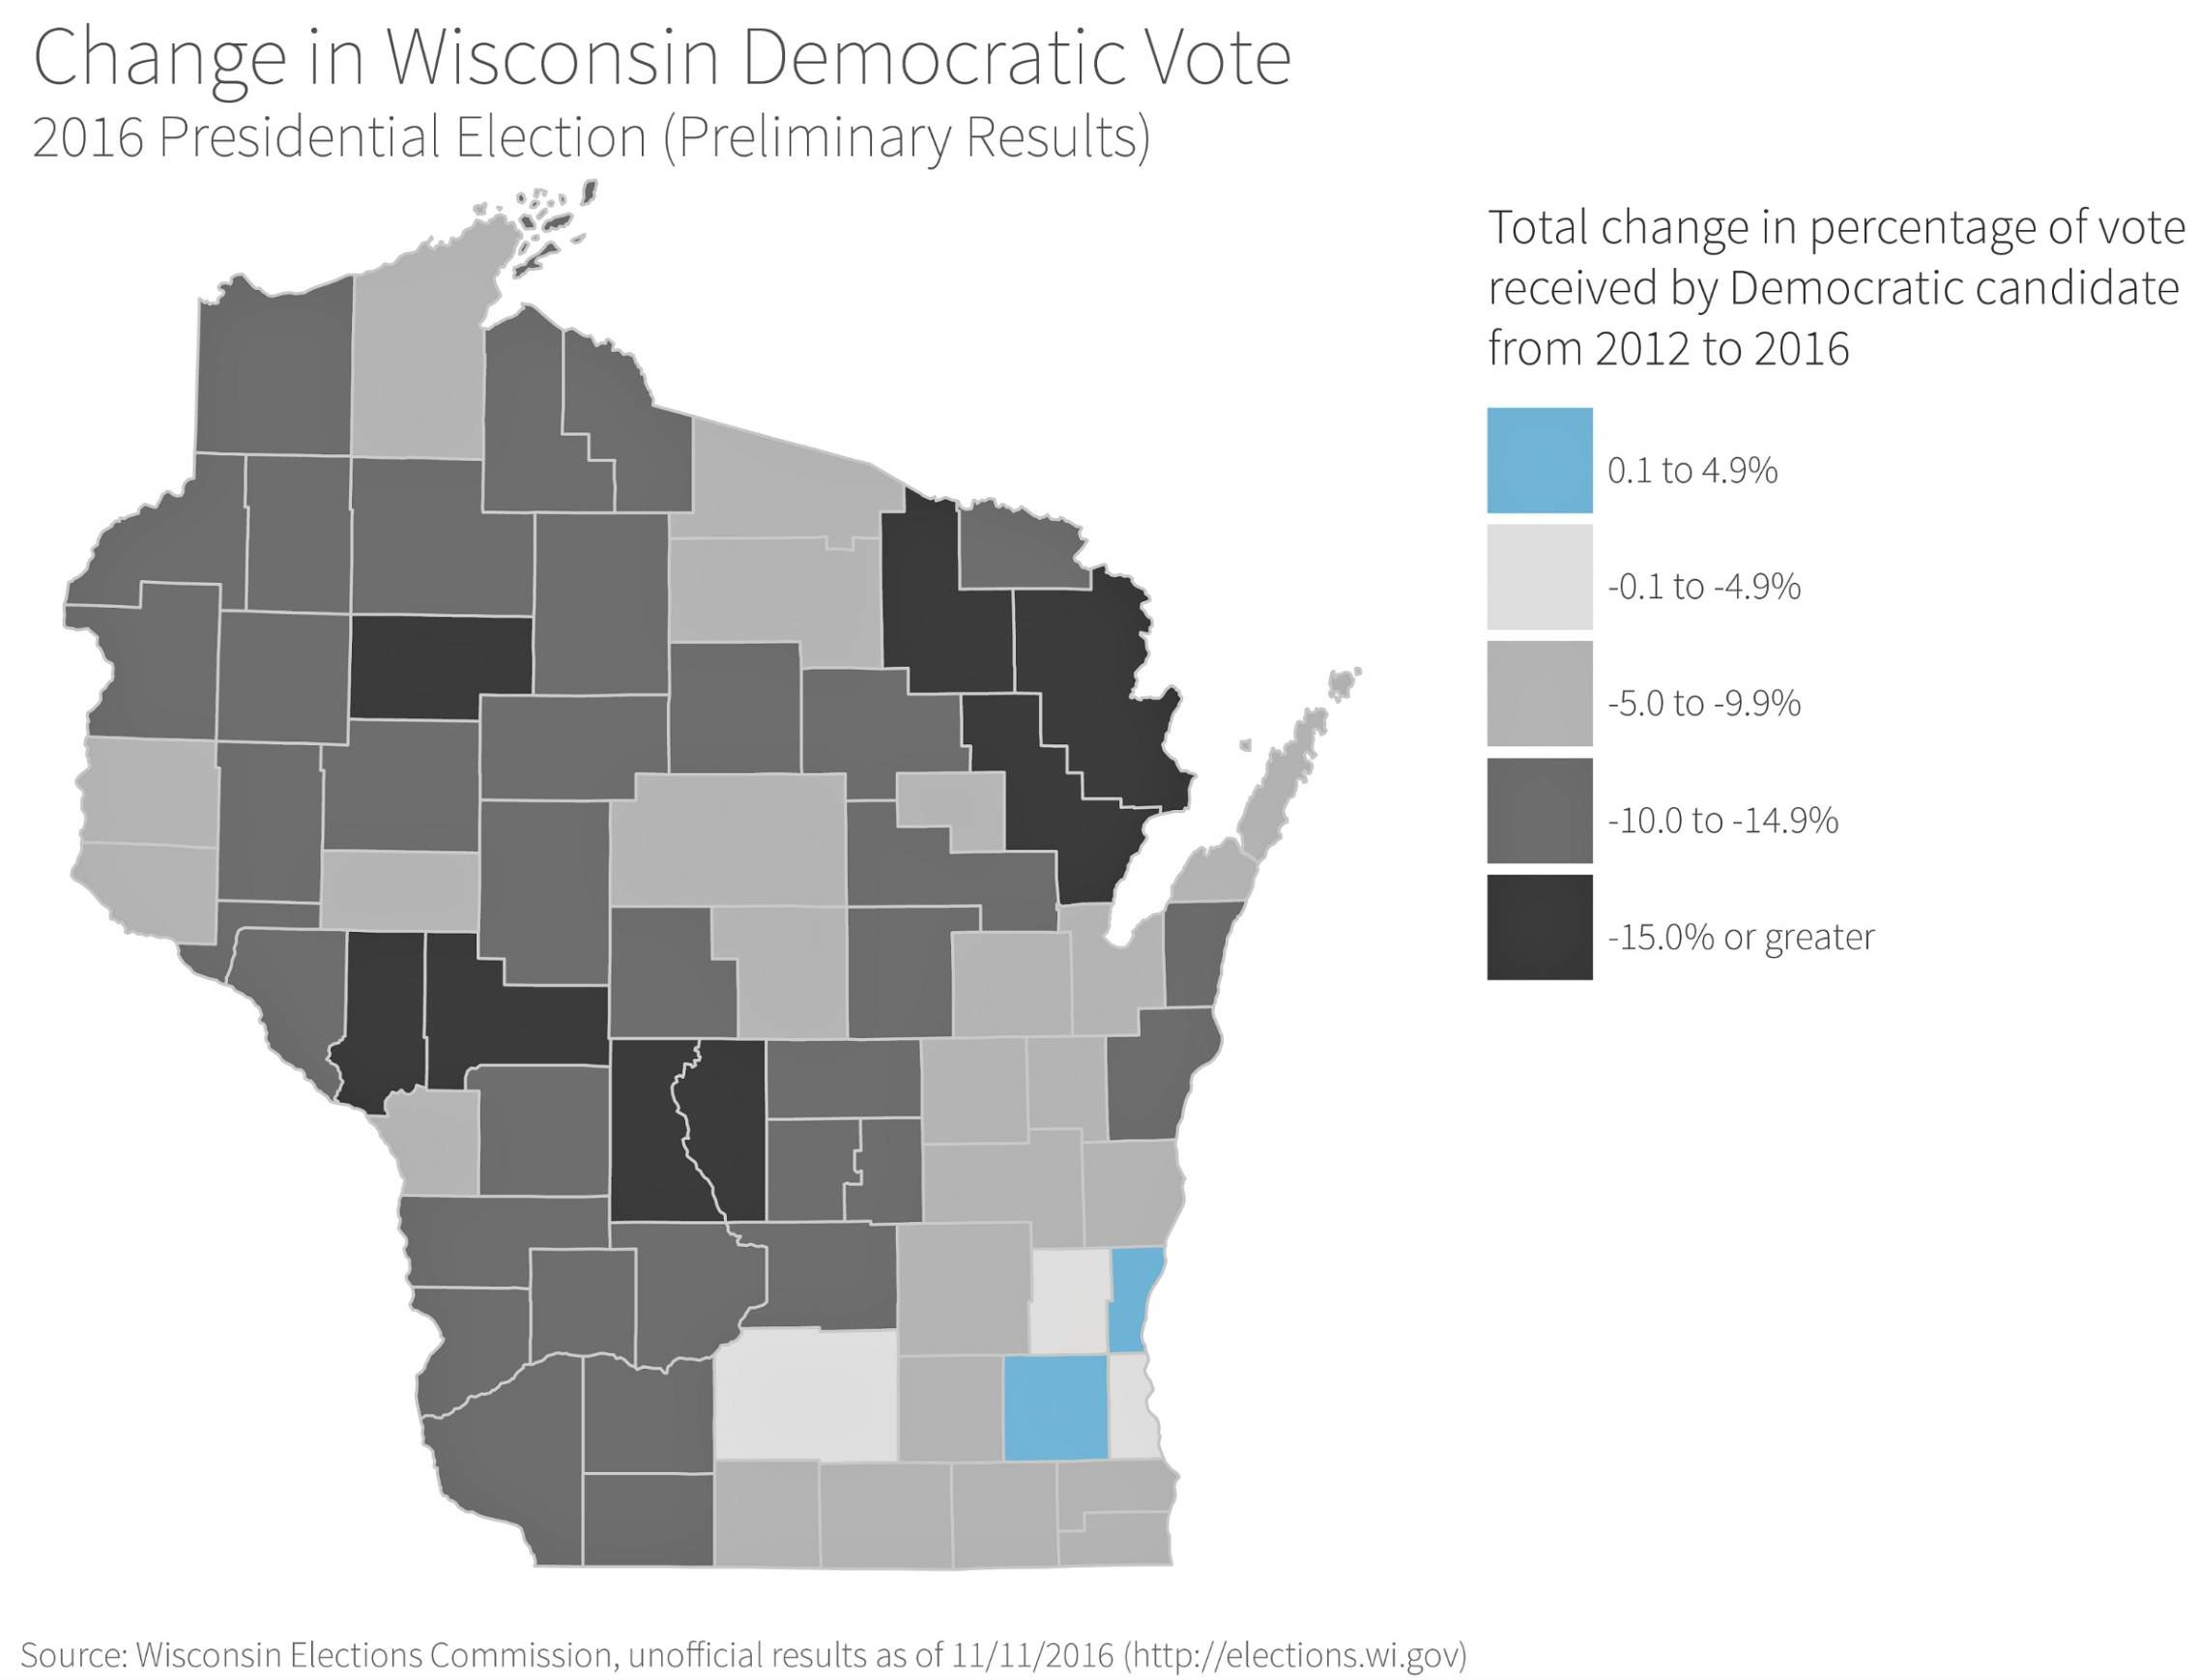
A few anomalies in this pattern are worth closer examination. Clinton did pick up more raw votes than Obama in 2012 in just three counties: Dane, Waukesha and Ozaukee. These are the three counties in Wisconsin with the highest educational attainment levels, and they are among the state’s most affluent. This pattern suggests that the college-educated, suburban-to-urban dwelling affluent population were more likely to vote for Clinton than other population subgroups. This apparent anomaly may be explained in part by the relative ease with which a more affluent population was able to conform to new photo ID voting laws.
The only two counties where Clinton ended up with a higher total percentage of the vote, compared to Obama in 2012, were Waukesha and Ozaukee. These are two of the three “WOW” counties (along with Washington County) that broadly include many conservative-leaning suburbs of Milwaukee. These three counties also saw much higher levels of support for Libertarian Party candidate Gary Johnson, who received more than 106,000 votes statewide.
In left-leaning Dane County, voter turnout was up slightly, even after considering an increase of over 18,000 people in its adult population since 2012. However, Clinton’s percentages were actually down slightly compared to Obama’s in 2012, at 70 and 71 percent of the county’s total vote, respectively. Although the voting-age population of Dane County grew substantially, those additional votes look to have gone to third-party candidates (and not to Trump). Still, Clinton was the clear winner in Dane County. Her relatively strong performance in Dane and Milwaukee counties compared to the rest of the state as a whole — and especially the conservative suburbs of the state’s urban centers — follows a longstanding pattern of growing partisan divisions in Wisconsin.
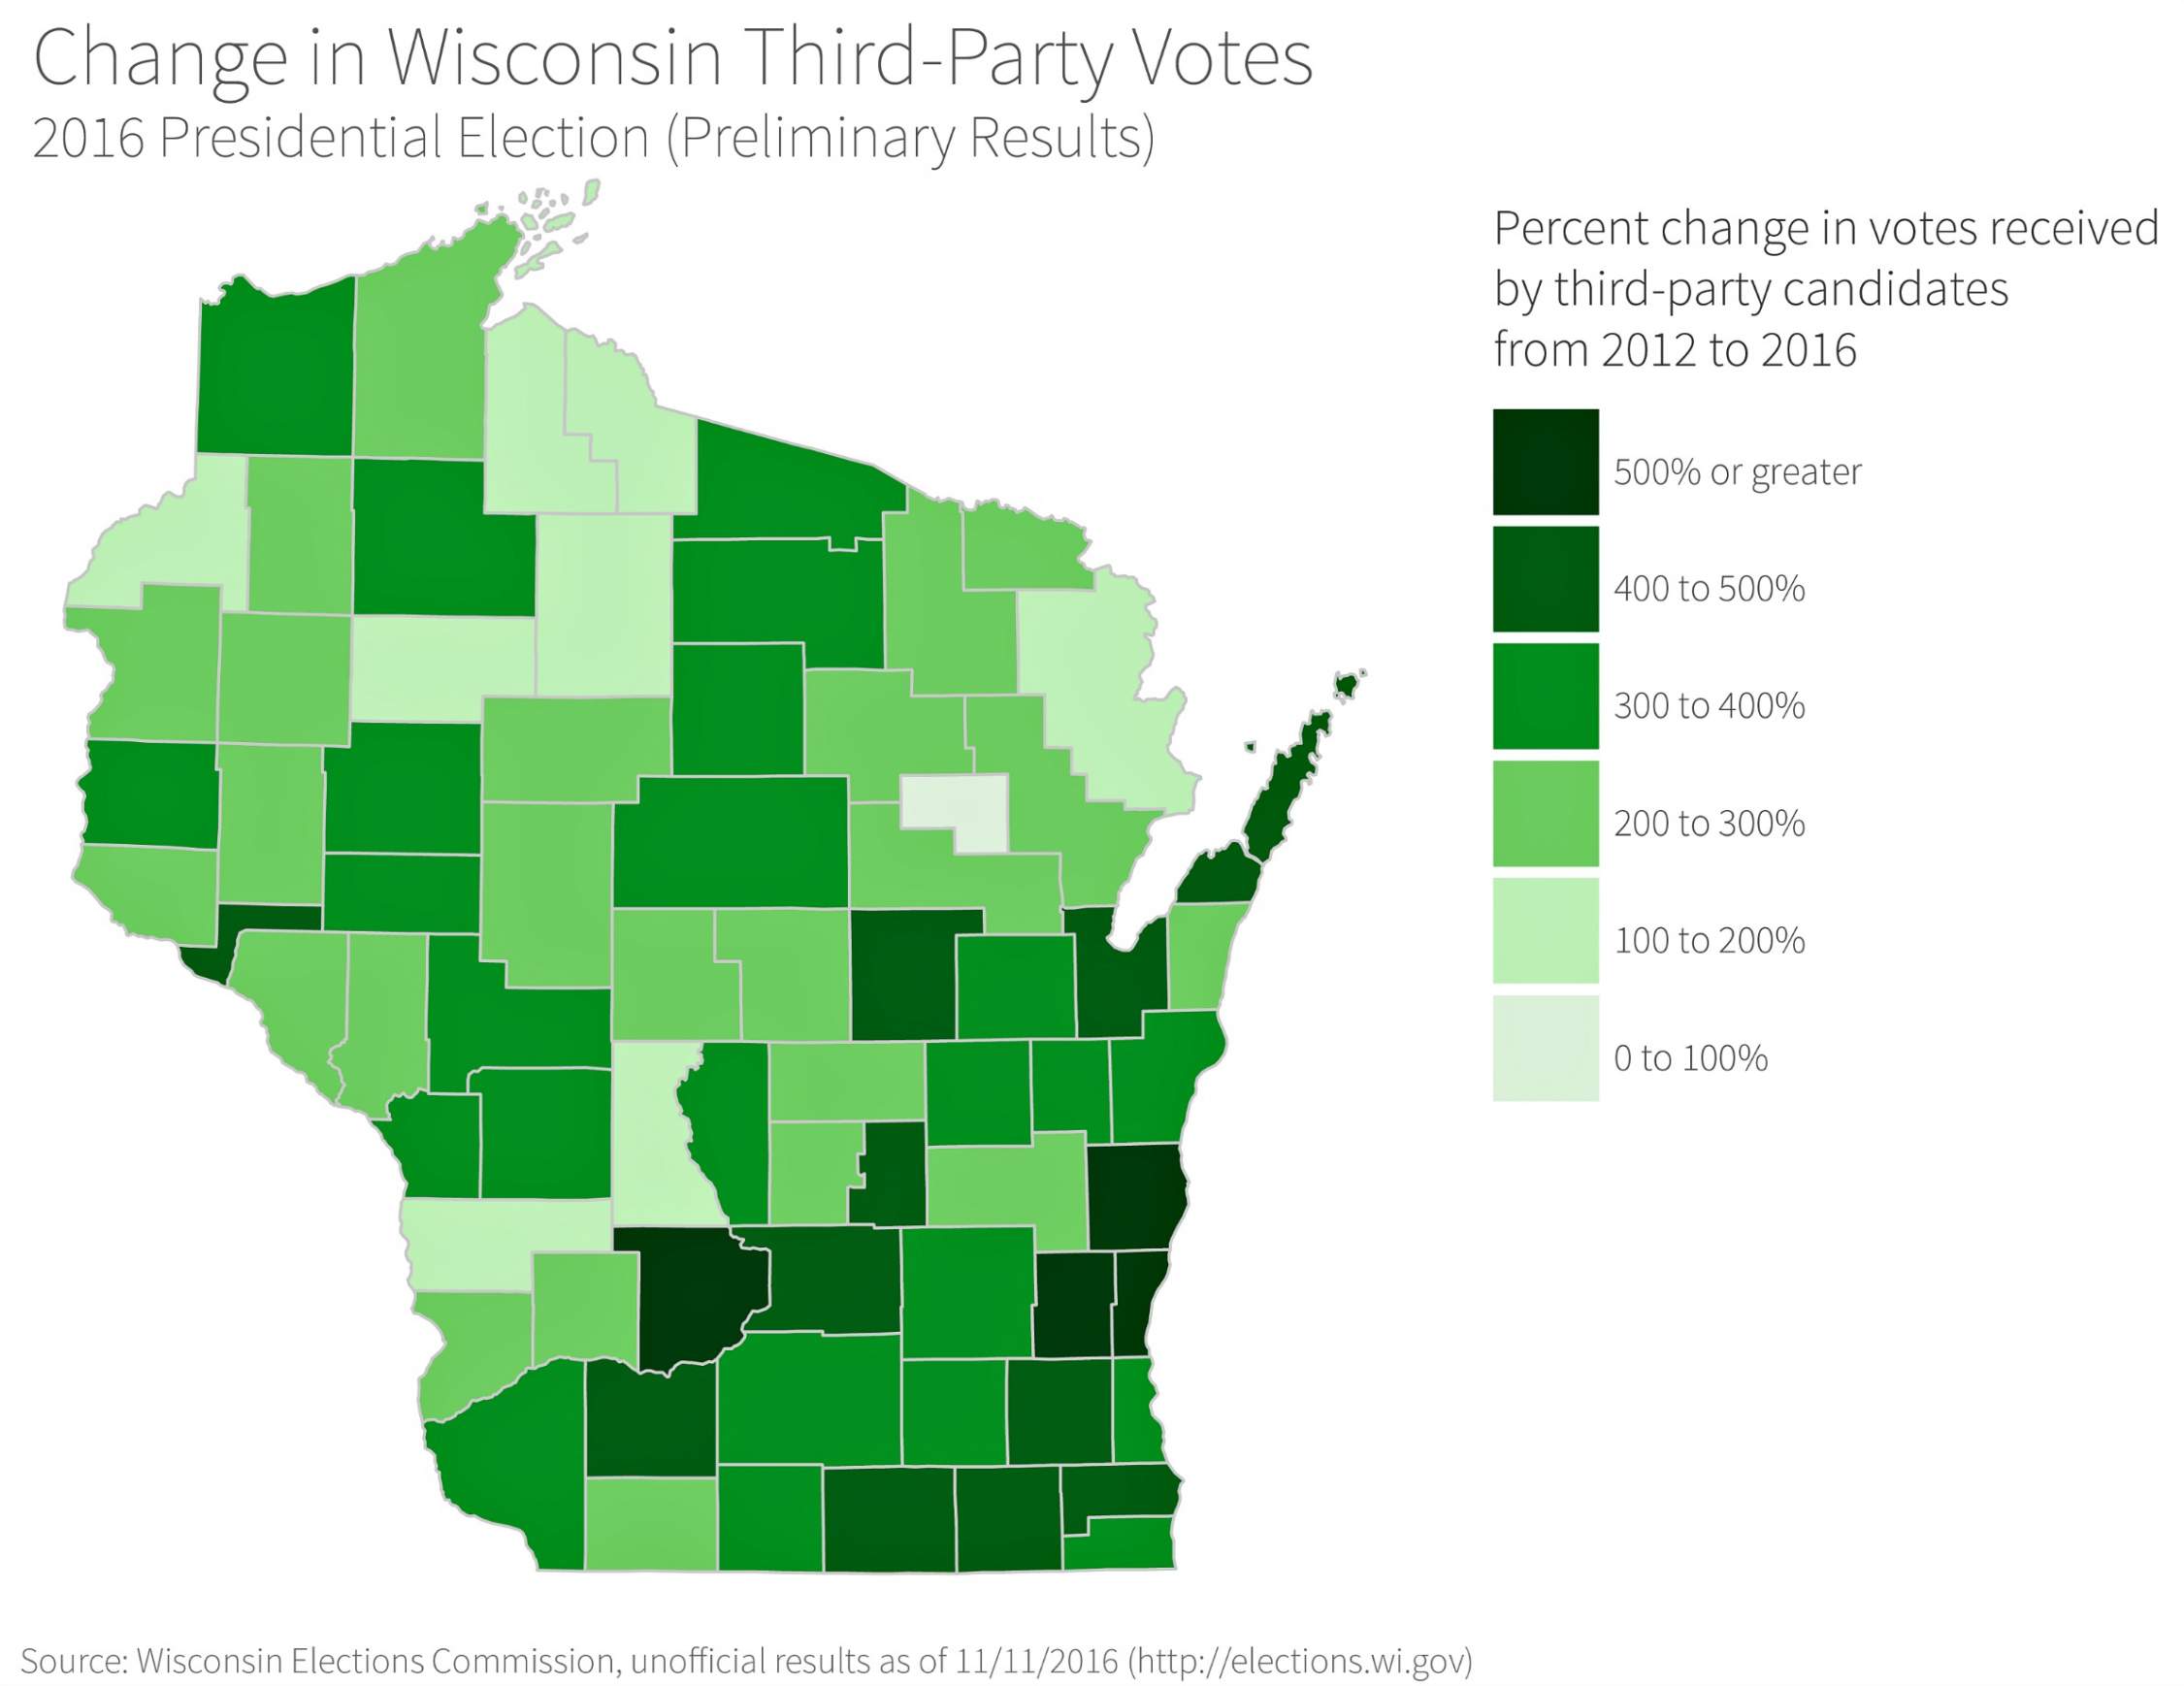
In the counties with larger urban centers and the suburban parts of southern Wisconsin, it appears that voters all around weren’t happy with their party’s candidate. The 2016 voting data indicate overall voter turnout was generally down, Trump did not perform as well as Romney did in 2012, Clinton’s support was underwhelming compared to Obama’s, and third-party candidates did very well compared to the last several presidential elections.
In Ozaukee County, for example, third-party candidates picked up 7 percent of the vote — compared to 1 percent in 2012. Overall, votes for third-party candidates were up 362 percent in Wisconsin as compared to 2012, and almost 400 percent in the metro areas. The fact that most of those votes went to Gary Johnson — a former Republican governor of New Mexico — suggests that they were cast by conservative-leaning voters who did not favor Trump (and not erstwhile supporters of Democratic candidates). The Green Party candidate, Jill Stein, picked up nearly 31,000 votes, a higher number than her 2012 numbers — but this increase was by a smaller margin.
Overall, this close examination of the county-level results of the Wisconsin presidential race in 2016 shows three main trends that each contributed to the final outcome in the state. The first trend is voter turnout, which was down statewide. Trump obtained about as many total votes as Romney did in 2012, but Clinton got far fewer compared to Obama’s 2012 performance. Low voter turnout was most pronounced in the major metro areas and their adjacent suburbs — especially Milwaukee, which house the largest share of Wisconsin’s voters.
The second trend is that Trump outperformed expectations set by Romney’s 2012 run as well as by most poll findings. His win, however, was uneven across the state. In rural areas, the Republican showing was stronger than in 2012, but the total number of votes did not alone make the difference in Wisconsin’s 10 electoral votes for 2016. However, Trump’s strong performance in the counties housing small and medium-sized urban centers and their suburbs — with their larger numbers of voters — was important. These counties have traditionally been “swing” areas, not voting consistently with a single party over the years. In 2012, on average they voted close to 50 percent for Romney and 50 percent for Obama. By contrast, in the major metro areas, Trump actually picked up fewer votes than Romney.
Finally, third-party voting cannot be ignored in 2016. A 365 percent increase in votes for third-party candidates, mostly for Johnson, suggests that some voters — especially those leaning conservative — were unhappy with their major party choices. This effect was most obvious in the conservative stronghold counties housing the Milwaukee suburbs, but was evident statewide.
Trump won Wisconsin’s rural counties by a margin of 16,642 votes — this total was not enough to tip the state’s election outcome by itself. Counties with smaller and medium-sized urban areas contributed about 125,000 votes to Trump’s margin in the state. The emerging political narrative that support from rural areas clinched the victory for Trump does not cover the totality of voting patterns in the election, at least in Wisconsin.
Editor’s note: This report was updated to reflect the unofficial voting totals reported by the Wisconsin Elections Commission as of Nov. 11, 2016.
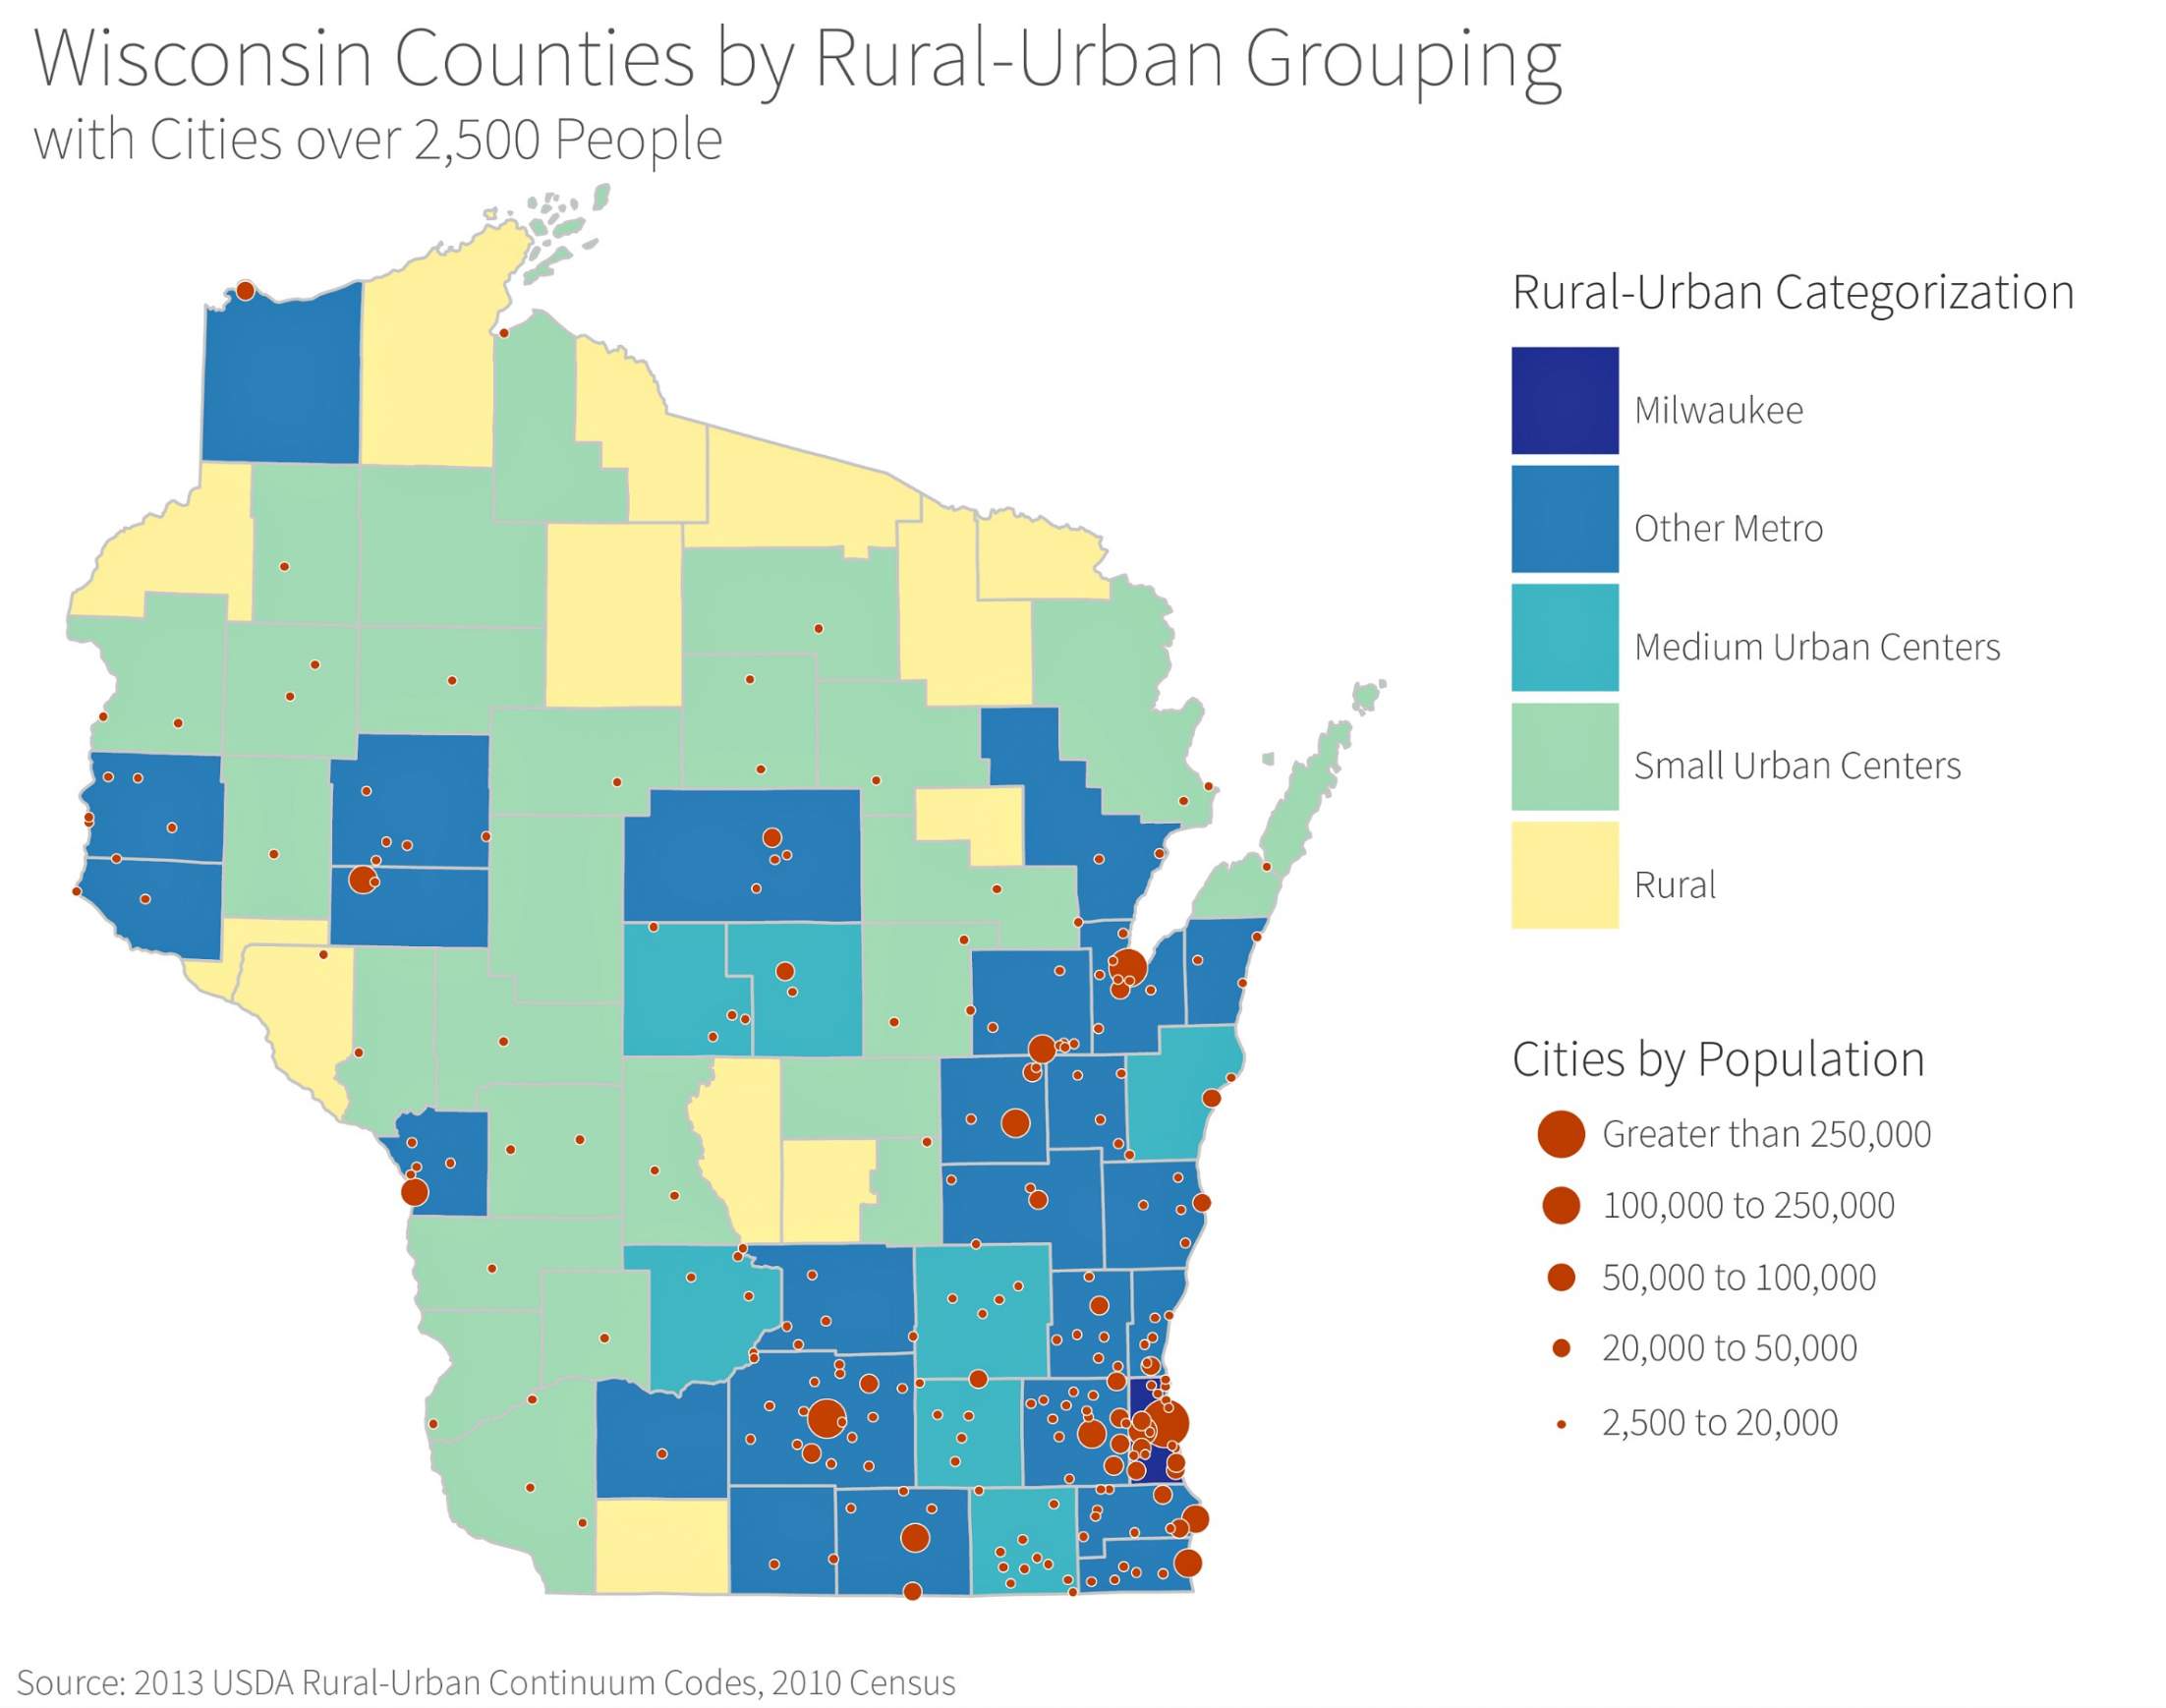
This analysis of voting patterns across Wisconsin in the 2016 presidential election organizes the state’s counties into five based on the size of their urban centers and their U.S. Department of Agriculture Rural-Urban Continuum Code. They are, in order of decreasing urban population: Milwaukee County; Other Metro counties (Brown, Calumet, Chippewa, Columbia, Dane, Douglas, Eau Claire, Fond du Lac, Green, Iowa, Kenosha, Kewaunee, La Crosse, Marathon, Oconto, Outagamie, Ozaukee, Pierce, Racine, Rock, Sheboygan, St. Croix, Washington, Waukesha and Winnebago); Medium Urban Centers counties with urban population of 20,000 or more, but outside of major metro areas (Dodge, Jefferson, Manitowoc, Portage, Sauk, Walworth and Wood); Small Urban Centers counties with urban population of 2,500-19,999 (Ashland, Barron, Clark, Crawford, Door, Dunn, Grant, Green Lake, Jackson, Juneau, Langlade, Lincoln, Marinette, Monroe, Oneida, Polk, Richland, Rusk, Sawyer, Shawano, Taylor, Trempealeau, Vernon, Washburn, Waupaca, and Waushara); and Rural counties with no population center of 2,500 or greater (Adams, Bayfield, Buffalo, Burnett, Florence, Forest, Iron, Lafayette, Marquette, Menominee, Pepin, Price and Vilas).
Malia Jones is a social epidemiologist with the University of Wisconsin Applied Population Laboratory who studies segregation and its health consequences.


 Fourth Congressional District.'")


Follow Us