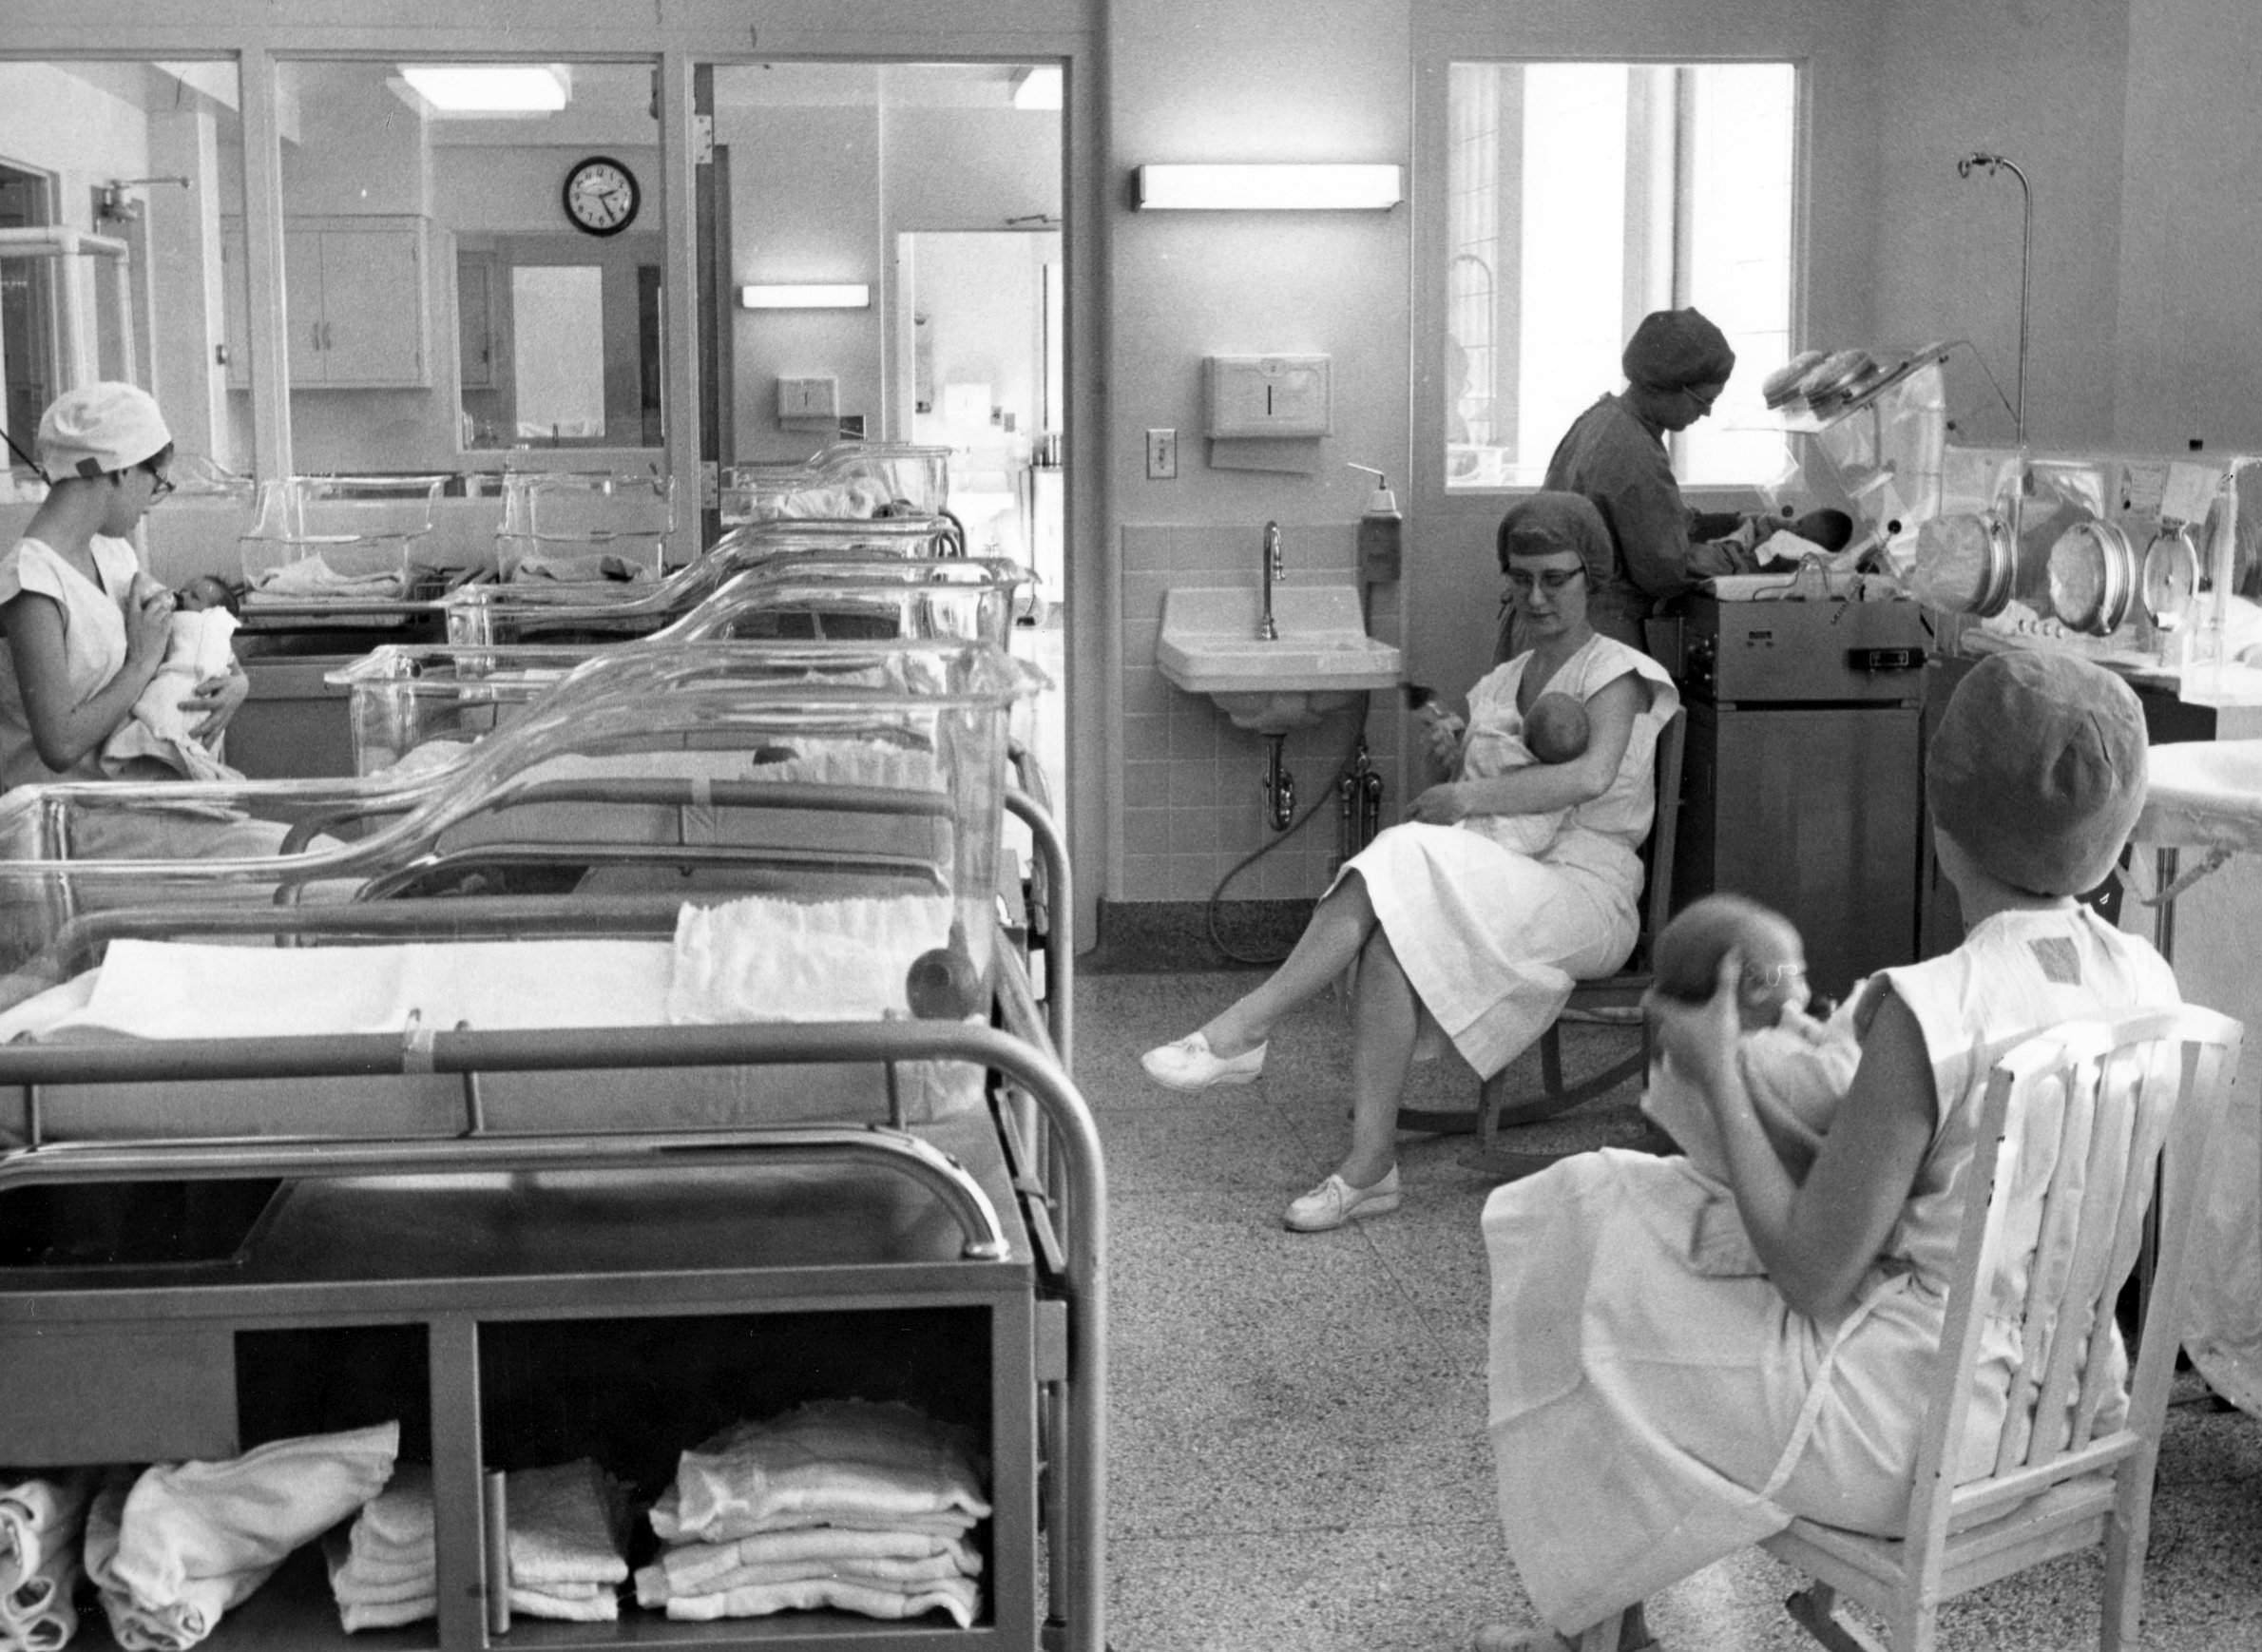
John Newhouse/Wisconsin Historical Society
Newborn babies are cared for at a Wisconsin neonatal hospital unit in 1950.

The number of babies born in a given year can have deep social and economic implications, as both younger and older adults may know from their experiences in crowded schools, competitive job markets, and, for the latter, retirement destinations.
Birth rates are one of the fundamental demographic processes that can can affect everything from school enrollment to unemployment to the Social Security system. Large cohorts can mean unexpected strain on delivery hospitals and kindergarten classrooms, while an unexpectedly low number of births can mean dropping numbers of students as well as fewer young people entering job markets, buying homes and paying taxes — in short, supporting the economy.
There are several ways that demographers measure the relative number of births over a short time frame in order to make comparisons across time and places. In all cases, the factor of births remains the same, though what they're compared to varies. All measures provide a single-number "snapshot" of birth patterns.
In the crude birth rate metric, total births are divided by total population. If a population is skewed young (e.g. less than 20) or old (e.g. greater than 50), the crude birth rate tends to be lower due simply to the age distribution.
For general fertility rate, total births are divided by the actual or estimated female population in a limited age range, often 15-44 years old. While more accurate than the crude birth rate, it can also be affected by skewing of the age distribution. Larger proportions of younger and/or older women in this range (who have lower fertility rates) will likewise cause the general fertility rate to be lower.
Total fertility rate attempts to address the age distribution issue. In this measurement, births to mothers in an age range are divided by the number of women in that age range to generate an age-specific fertility rate. These rates are in turn added up to produce a total fertility rate. The measure is described as "the number of children a woman would have in her lifetime if current fertility patterns held true." In other words, the idea is to determine the average number of babies that would be born to each woman, assuming that she survives through her reproductive years and age-specific birth rates remain stable. More simply, it can be understood as the current average number of births per woman.
The total fertility rate best reflects the combination of the contemporary pattern of births and women's age distribution in the population. Over time, these rates have seen considerable swings across the United States and in Wisconsin. Changes can be observed in several key phases that defined major demographic trends over the past seven decades.

The baby boom is recognized as starting in the United States in 1946 and continuing through 1964. A period during which birth rates skyrocketed in the nation, it followed a period of relatively low birth rates during the Great Depression in the 1930s and the subsequent World War II era.
Early in this post-war period, in only two years, the total fertility rate increased 37 percent in Wisconsin and 31 percent nationally. After remaining stable for several years, fertility rates rose even higher through the 1950s, with the national rate peaking in 1957 and the state's rate hitting its maximum in 1960. Wisconsin's peak fertility rate of 4.134 in 1960 was 68 percent higher than the rate in 1945.
In terms of sheer numbers, Wisconsin reached its highest number of births ever in 1960, with some 99,500 babies. Births for the entire Baby Boom period of 1946 through 1964 in the state averaged more than 90,000 annually, compared to 56,000 per year from 1930 through 1945.
In 1960, the U.S. Food and Drug Administration approved the use of oral contraceptives, leading to a reduction in fertility rates and births. The subsequent decade also saw important cultural changes which opened doors for women to take on more roles outside the home, increasing opportunity costs of childbearing for women.
In the U.S. and Wisconsin, the fertility rate and number of births fell steadily from 1960 through 1973. Birth rates in both slipped below the generally recognized "replacement level" for the first time in 1972. Replacement level fertility results in a population that exactly replaces itself from one generation to the next, without growing or shrinking. In developed nations, a generally accepted value for replacement fertility is 2.1 children per woman.
The total fertility rate stands in as a proxy for measuring a replacement rate. In numeric terms, Wisconsin had the smallest number of births in 1973 — 62,800 — since 1945. The legalization of abortion in 1973 may have reduced births and the fertility rate slightly nationally and in Wisconsin, but births in the state actually rose in 1974. The "early boomers," born 1946 to 1954, were in their peak reproductive years at this time, boosting the number of births.
The Wisconsin and U.S. total fertility rates remained close to each other through the period from 1974 to 1986. This was an era when many baby boomers had babies, straddling the cohorts often called Generation X and Millennials. Although each woman did not have a large number of children during this time period, the large number of women having babies made for a larger birth cohort. In 1980, the count of Wisconsin births rose to 75,000.
Between 1987 and 2007, the national and state total fertility rates began to separate. Wisconsin’s rate remained consistently lower throughout the period. Paradoxically, this difference can be attributed to a completely different population process: immigration.
Immigrants tend to have higher initial birth rates than the native-born U.S. population, and increasing immigration in the late 1980s and 1990s occurred largely in other states. This led to a slight increase in births and birth rates elsewhere, while Wisconsin's rates remained stable. The national total fertility rate dropped to replacement level in 2006.
The Great Recession, which officially ran from 2007 to 2009 in the U.S., has had an ongoing depressing effect on birth rates and the number of births. In this era, the nation's total fertility rate has fallen more rapidly than that in Wisconsin. In numeric terms, Wisconsin’s births declined from a high of 72,750 in 2007 to 67,000 in 2015, a decrease of 8 percent.
Along with a drop in birth rates, Wisconsin has seen a decline in the number of people moving to it from other states, particularly in rural areas, with some counties projected to lose population over the next couple of decades.
The trend of decreased fertility rates in the 2010s might mean trouble on the horizon in Wisconsin and around the U.S., particularly for some sectors of the economy. As baby boomers leave the workforce and begin to receive retirement benefits, many institutions — government bodies, businesses, religious groups, non-profit charities and more — will have to grapple with the fact that their ranks will not be replaced completely.